
Discover HUBBELL INC (NYSE:HUBB)—a stock that our stock screener has recognized as a solid dividend pick with strong fundamentals. HUBB showcases decent financial health and profitability while providing a sustainable dividend. We'll explore the specifics further.
Deciphering HUBB's Dividend Rating
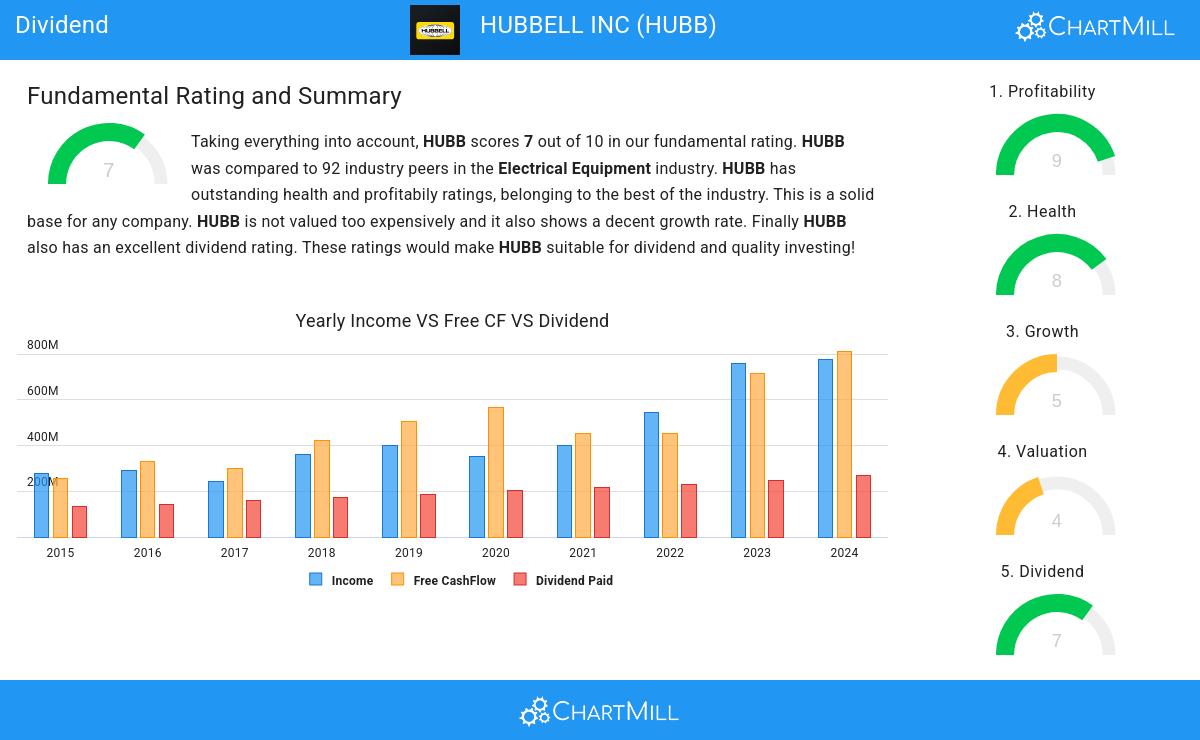
ChartMill assigns a Dividend Rating to each stock, ranging from 0 to 10. This rating is calculated by analyzing various dividend elements, such as yield, historical performance, dividend growth, and sustainability. HUBB has been awarded a 7 for its dividend quality:
- HUBB's Dividend Yield is rather good when compared to the industry average which is at 3.97. HUBB pays more dividend than 90.22% of the companies in the same industry.
- On average, the dividend of HUBB grows each year by 7.79%, which is quite nice.
- HUBB has been paying a dividend for at least 10 years, so it has a reliable track record.
- HUBB has not decreased their dividend for at least 10 years, which is a reliable track record.
- 34.43% of the earnings are spent on dividend by HUBB. This is a low number and sustainable payout ratio.
- HUBB's earnings are growing more than its dividend. This makes the dividend growth sustainable.
Deciphering HUBB's Health Rating
A critical element of ChartMill's stock evaluation is the Health Rating, which spans from 0 to 10. This rating considers multiple health factors, including liquidity and solvency, both in absolute terms and relative to industry peers. HUBB has received a 8 out of 10:
- An Altman-Z score of 5.43 indicates that HUBB is not in any danger for bankruptcy at the moment.
- HUBB has a better Altman-Z score (5.43) than 91.30% of its industry peers.
- HUBB has a debt to FCF ratio of 1.93. This is a very positive value and a sign of high solvency as it would only need 1.93 years to pay back of all of its debts.
- HUBB has a better Debt to FCF ratio (1.93) than 85.87% of its industry peers.
- HUBB has a Debt/Equity ratio of 0.48. This is a healthy value indicating a solid balance between debt and equity.
- HUBB does not score too well on the current and quick ratio evaluation. However, as it has excellent solvency and profitability, these ratios do not necessarly indicate liquidity issues and need to be evaluated against the specifics of the business.
What does the Profitability looks like for HUBB
ChartMill employs its own Profitability Rating system for stock evaluation. This score, ranging from 0 to 10, is derived from an analysis of diverse profitability metrics and margins. In the case of HUBB, the assigned 9 is noteworthy for profitability:
- With an excellent Return On Assets value of 11.62%, HUBB belongs to the best of the industry, outperforming 95.65% of the companies in the same industry.
- HUBB's Return On Equity of 23.75% is amongst the best of the industry. HUBB outperforms 94.57% of its industry peers.
- Looking at the Return On Invested Capital, with a value of 15.56%, HUBB belongs to the top of the industry, outperforming 94.57% of the companies in the same industry.
- The Average Return On Invested Capital over the past 3 years for HUBB is above the industry average of 9.82%.
- The 3 year average ROIC (14.28%) for HUBB is below the current ROIC(15.56%), indicating increased profibility in the last year.
- HUBB has a better Profit Margin (13.79%) than 93.48% of its industry peers.
- In the last couple of years the Profit Margin of HUBB has grown nicely.
- HUBB has a better Operating Margin (19.62%) than 97.83% of its industry peers.
- In the last couple of years the Operating Margin of HUBB has grown nicely.
- Looking at the Gross Margin, with a value of 33.99%, HUBB is in the better half of the industry, outperforming 79.35% of the companies in the same industry.
- HUBB's Gross Margin has improved in the last couple of years.
More Best Dividend stocks can be found in our Best Dividend screener.
For an up to date full fundamental analysis you can check the fundamental report of HUBB
Disclaimer
Important Note: The content of this article is not intended as trading advice. It is essential to perform your own analysis and exercise caution when making trading decisions. The article presents observations created by automated analysis but does not guarantee any trading or investment outcomes. Always trade responsibly and make independent judgments.