
A combined approach to stock selection that integrates both fundamental and technical analysis offers investors a complete framework for identifying possible opportunities. This methodology focuses on companies showing good underlying business metrics while also displaying positive chart patterns. By screening for stocks with good growth characteristics, solid profitability, and healthy financials, complemented by technical setups indicating possible price breakouts, investors try to capture companies with both good business fundamentals and positive momentum signals.
Harmony Biosciences Holdings (NASDAQ:HRMY) presents an interesting case study within this investment framework. The pharmaceutical company focuses on developing therapies for neurological disorders, with its main product WAKIX addressing excessive daytime sleepiness in narcolepsy patients.
Fundamental Strength Assessment
Harmony Biosciences shows very good fundamental characteristics that match growth investing criteria. The company's fundamental analysis report reveals an overall rating of 8/10, with particular strength across multiple dimensions important for sustainable growth.
Growth metrics show good traction:
- Revenue has grown by 17.74% in the past year with a 160.13% average annual growth rate over recent years
- Earnings Per Share increased 49.76% year-over-year with a 44.61% average annual growth
- Forward estimates project 30.22% EPS growth and 14.36% revenue growth annually
Profitability indicators are better than industry standards:
- Return on Equity of 23.40% is higher than 94% of pharmaceutical peers
- Profit margin of 23.42% is near the top of industry leaders
- Operating margin of 28.72% is higher than 93% of competitors
Financial health remains good:
- Debt/Equity ratio of 0.20 shows little leverage dependency
- Current ratio of 3.84 shows strong short-term liquidity
- Altman-Z score of 4.77 indicates low bankruptcy risk
Valuation Considerations
Despite its growth path, Harmony Biosciences trades at good valuation multiples:
- P/E ratio of 8.59 compares well to industry average of 24.35
- Forward P/E of 6.53 sits much lower than market averages
- Enterprise Value/EBITDA ratio is lower than 97% of industry peers
These valuation metrics become particularly interesting when considered next to the company's growth rates and profitability, indicating possible undervaluation relative to the company's fundamental performance.
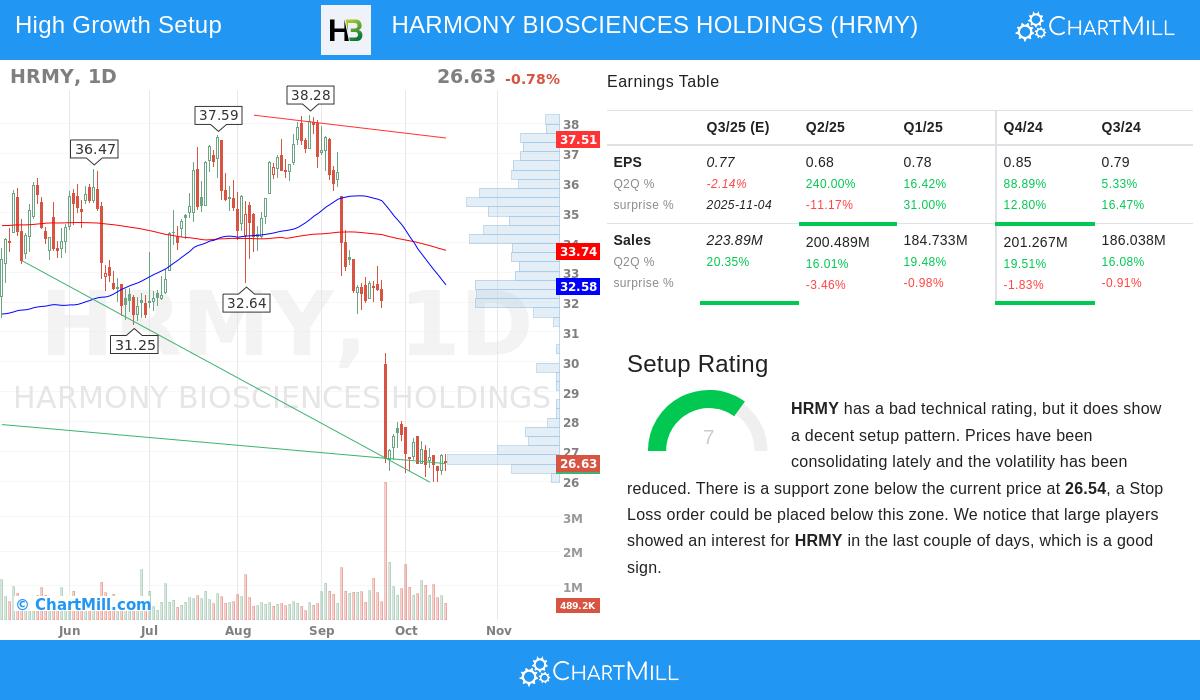
Technical Setup Analysis
The technical analysis reveals an interesting difference between recent price performance and new pattern development. While the stock has seen downward pressure in the short and medium term, current conditions indicate a possible reversal setup.
Key technical observations include:
- Stock trading near the lower end of its 52-week range between $25.95 and $41.61
- Clear support zone found between $26.36 and $26.54
- Lower volatility and consolidation in recent trading sessions
- Setup rating of 7/10 shows positive pattern development
The technical setup indicates that despite poor recent performance, the stock may be forming a base at current levels. The defined support zone gives a logical level for risk management, while the consolidation pattern could come before a possible breakout.
Strategic Implications
The mix of good fundamental metrics and new technical patterns makes Harmony Biosciences an interesting candidate for investors using a growth-with-momentum strategy. The company's very good growth rates, high profitability, and clean balance sheet provide the fundamental basis, while the technical setup offers a possible entry point following recent price weakness.
This alignment speaks to core growth investing principles: the company works in the specialized neurological disorder market with large unmet needs, keeps competitive advantages through its new mechanism of action, and shows the financial ability to maintain its growth initiatives. The current technical pattern, while coming from a period of weakness, presents the kind of consolidation that often comes before meaningful moves when paired with good fundamentals.
For investors looking for similar opportunities that mix good growth fundamentals with positive technical patterns, more screening results are available through our Strong Growth Stocks with Technical Setup screen.
Disclaimer: This analysis is provided for informational purposes only and does not constitute investment advice, recommendation, or endorsement of any security. Investors should conduct their own research and consult with a qualified financial advisor before making investment decisions. Past performance is not indicative of future results, and all investments carry risk including potential loss of principal.