
Our stock screener has flagged HEWLETT PACKARD ENTERPRISE (NYSE:HPE) as a potential breakout candidate. This occurs when the stock shows signs of consolidation after a notable upward trend. While we can't predict the actual breakout, it's worth monitoring NYSE:HPE for potential movement.
What is the technical picture of NYSE:HPE telling us.
At ChartMill, a crucial aspect of their analysis is the assignment of a Technical Rating to each stock. This rating, ranging from 0 to 10, is calculated daily by considering numerous technical indicators and properties.
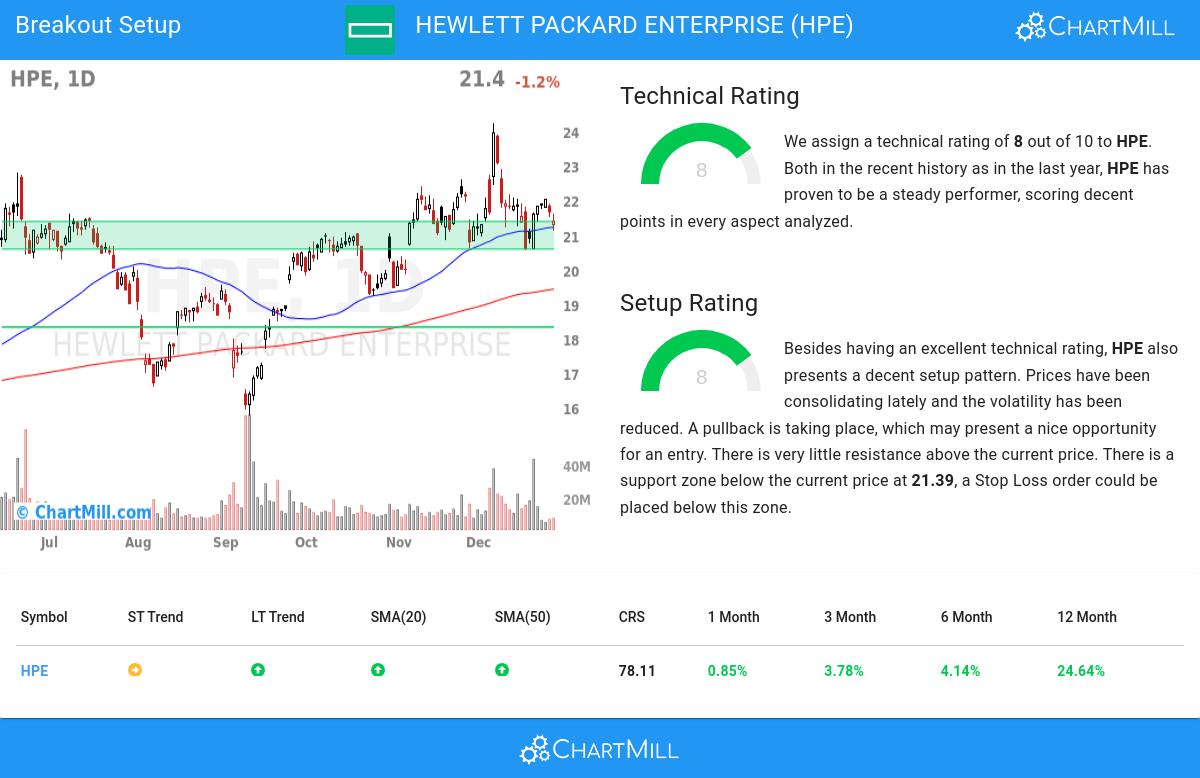
We assign a technical rating of 8 out of 10 to HPE. This is due to a consistent performance in both the short and longer term time frames. Also compared to the overall market, HPE is showing a nice and steady performance.
- The short term is neutral, but the long term trend is still positive. Not much to worry about for now.
- When comparing the yearly performance of all stocks, we notice that HPE is one of the better performing stocks in the market, outperforming 78% of all stocks. We also observe that the gains produced by HPE over the past year are nicely spread over this period.
- HPE is currently trading in the upper part of its 52 week range. The S&P500 Index is also trading in the upper part of its 52 week range, so HPE is performing more or less in line with the market.
- HPE is part of the Technology Hardware, Storage & Peripherals industry. There are 31 other stocks in this industry, HPE did better than 50% of them.
For an up to date full technical analysis you can check the technical report of HPE
Looking at the Setup
Besides the Technical Rating, ChartMill assigns a Setup Rating to every stock to determine the degree of consolidation. This rating, ranging from 0 to 10, is updated daily and evaluates various short-term technical indicators. NYSE:HPE currently holds a 8 as its setup rating, suggesting a particular level of consolidation in the stock.
Besides having an excellent technical rating, HPE also presents a decent setup pattern. We see reduced volatility while prices have been consolidating in the most recent period. A pullback is taking place, which may present a nice opportunity for an entry. There is very little resistance above the current price. There is a support zone below the current price at 21.39, a Stop Loss order could be placed below this zone.
Trading setups like NYSE:HPE
For a potential trade one would typically wait until the stock breaks out of the consolidation zone to enter the stock and it could be sold again for a loss when it would fall back below the zone.
Disclaimer: This article is not intended to provide trading advice. It is crucial to conduct your own analysis and consider your own observations and trading style when making investment decisions. The article solely presents technical observations and should not be relied upon as a sole basis for trading.
Every day, new breakout setups can be found on ChartMill in our Breakout screener.
Keep in mind
Important Note: The content of this article is not intended as trading advice. It is essential to perform your own analysis and exercise caution when making trading decisions. The article presents observations created by automated analysis but does not guarantee any trading or investment outcomes. Always trade responsibly and make independent judgments.