
For technical investors, finding stocks that are in a solid uptrend and also forming a tight pattern is a key part of breakout trading methods. The aim is to locate leading stocks that are resting before their next possible rise, giving a good entry point when considering risk and reward. An organized method to locate these chances is by using the ChartMill Technical Breakout Setups screen, which selects for stocks with a high Technical Rating (showing a solid trend) and a high Setup Quality Rating (showing a consolidation). This process seeks to answer two important questions: which stocks are in good technical condition, and when is a suitable moment to think about an entry.
Hess Midstream LP - Class A (NYSE:HESM) recently appeared from such a search, showing a profile that deserves more attention from a technical viewpoint. The midstream energy company, which runs important oil and gas systems in North Dakota's Williston Basin, is displaying chart traits that frequently come before notable price movements.
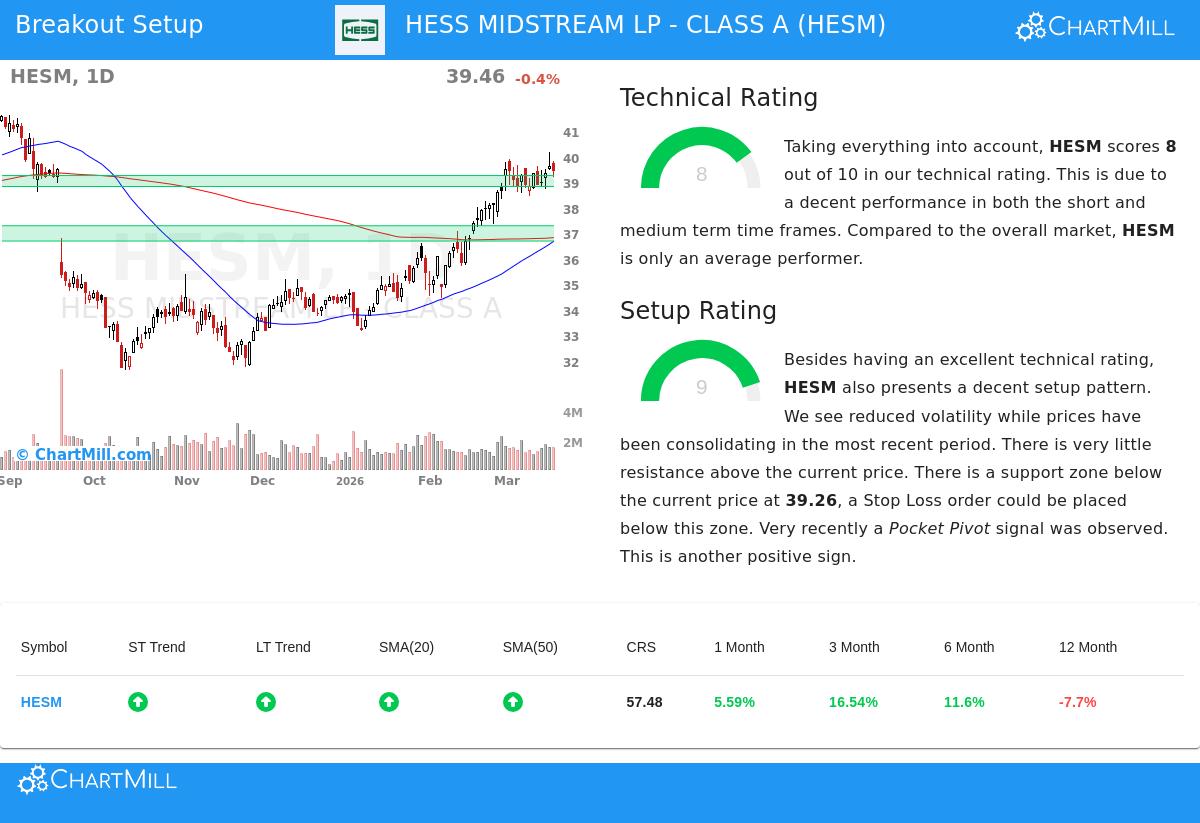
Technical Strength: A Firm Base
The main requirement for any breakout candidate is a solid existing trend. Hess Midstream receives a solid ChartMill Technical Rating of 8 out of 10, indicating good technical condition. This number comes from reviewing several items, like relative strength, moving averages, and trend direction across different time periods. A high rating here is important because it verifies the stock is already in a positive uptrend, raising the chance that a breakout from a consolidation will keep going in the current direction.
Important parts backing this rating for HESM include:
- Positive Trend Agreement: Both the long-term and short-term trends for the stock are scored as positive. This agreement across time periods is a clear mark of a good, continued rise.
- Solid Moving Average Backing: The stock is priced above all its main simple moving averages (20, 50, 100, and 200-day), and each of these averages is itself in a rising pattern. This forms several possible support levels below the price.
- Sturdy Performance: Over the last three and six months, HESM has recorded increases of about 16.5% and 11.6%, in that order, showing steady upward movement even while the wider S&P 500 has dealt with a negative long-term trend.
While the stock has done worse than many others in the Oil & Gas industry over the past year, its recent multi-month climb and solid trend scores point to a time of improving relative strength. The complete technical review can be seen in the ChartMill Technical Report for HESM.
Setup Quality: The Resting Period
A solid trend by itself is not a buy signal; entering after a steep climb brings the danger of a quick decline. This is where the Setup Quality Rating becomes key. It measures if the stock is forming a useful consolidation, a pause that renews the trend. Hess Midstream has a very good Setup Rating of 9, showing a high-grade pattern is present.
This high score comes from a few visible conditions on the chart:
- Lower Volatility & Narrow Trading: The report mentions "lower volatility while prices have been consolidating." Over the past month, HESM has moved within a set range ($37.23 - $40.19), and it is now testing the top edge of that range. This tightening action often comes before a directional move.
- Defined Support and Resistance: The review finds a clear support area between $38.83 and $39.26, made by a combination of trendlines and moving averages. Just above, resistance is seen near $42.75. A well-marked range allows for accurate planning of entry and exit spots.
- Favorable Volume Behavior: A recent "Pocket Pivot" signal was seen, which is a volume-based sign pointing to accumulation, when price rises on volume higher than the largest down volume of the previous ten days. This can be a mark of institutional buying interest during the consolidation.
A Possible Trade Plan
The pairing of a Technical Rating of 8 and a Setup Rating of 9 forms a clear, rule-based situation. The automated review proposes a possible breakout plan with an entry just above the recent range high at $40.20, using a stop loss order set below the noted support area at $38.82. This would cap the theoretical risk on the trade to about 3.4%. It is a standard case of how these two ratings work together: the Technical Rating confirms the trend is favorable, while the Setup Rating finds a possible starting point.
Find Other Possible Breakouts The Technical Breakout Setups screen is operated each day to find new chances across the market. Investors searching for other stocks showing similar solid technicals and tight consolidations can view the present results using the Technical Breakout Setups screen.
Disclaimer: This article is for information only and is not investment advice, a suggestion, or an offer or request to buy or sell any securities. The trade plan described is created automatically and is for example only. It should not be taken as a specific suggestion. Always do your own research, think about your personal money situation and risk comfort, and talk with a qualified financial advisor before making any investment choices. Past results do not guarantee future outcomes.