
For investors watching chart patterns and momentum, a methodical process can help find stocks ready for their next upward move. One process uses filters for securities that join firm basic technical condition with a present price pause, indicating a possible breakout is approaching. This tactic depends on two specific scores from ChartMill: the Technical Rating, which measures the strength and direction of a stock's trend, and the Setup Quality Rating, which evaluates how narrowly a stock is trading and if it is making a clear pattern from which to advance. By selecting stocks with good scores in both areas, traders try to locate chances in market leaders that are in a short rest before possibly continuing their upward trend.
HA Sustainable Infrastructure Capital Inc. (NYSE:HASI), a provider of capital for climate projects, recently appeared from such a filter. With the wider S&P 500 showing positive long and short-term trends, the conditions are favorable for this kind of momentum-focused tactic. The argument for HASI as a technical formation depends on the full examination in its ChartMill Technical Report.
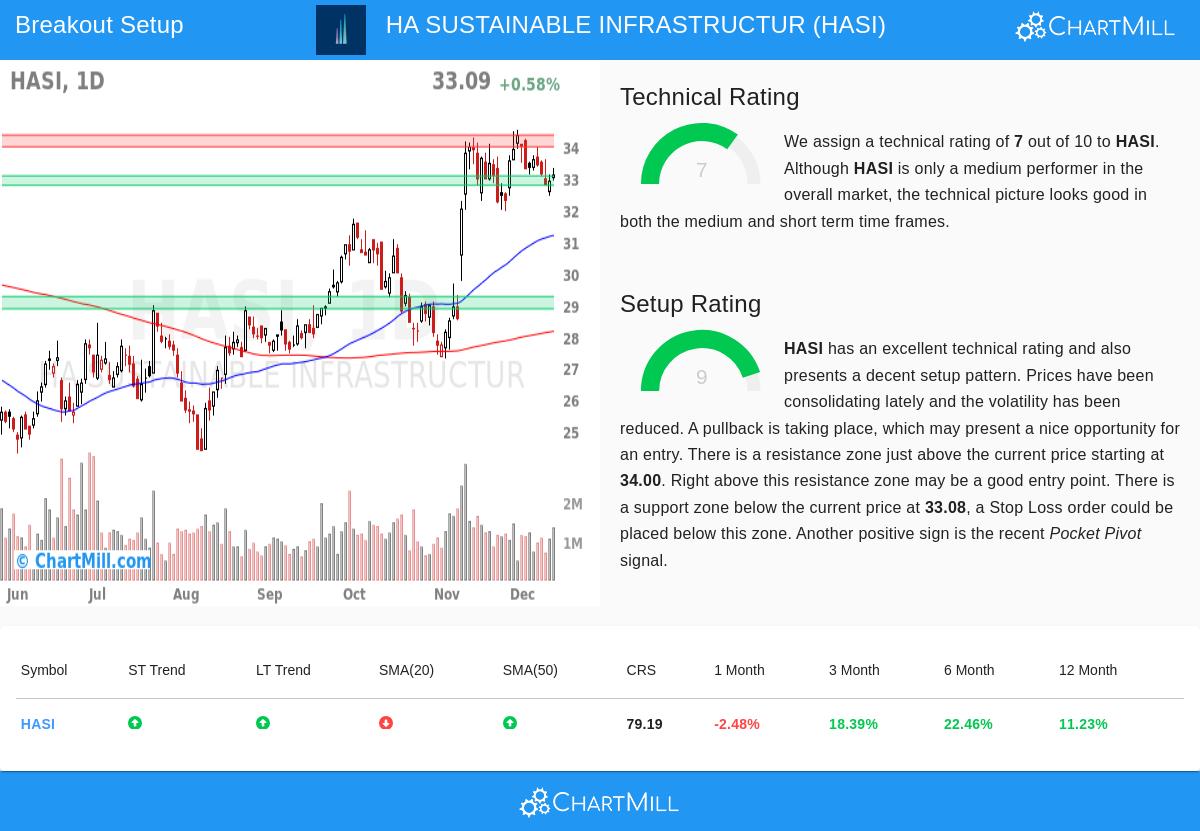
Reviewing the Technical Base
The first part of the breakout tactic is a firm technical rating, which verifies a stock is in a clear uptrend and is a relative strength leader. HASI receives a Technical Rating of 7 out of 10, showing a sound technical base. This score is backed by several important notes from the report:
- Trend Agreement: Both the short-term and long-term trends for HASI are scored as positive. This agreement across periods is a solid bullish sign, pointing to continued buying interest.
- Sector Performance: The stock performs better than 86% of similar companies in the Financial Services field. This relative strength is a key part of the Technical Rating, as it finds market leaders.
- Place vs. Market: While HASI is trading in the higher part of its own 52-week range, the report states it is a little behind the S&P 500, which is close to a new peak. This can occasionally offer a chance to gain ground if the stock's positive trend persists.
- Moving Average Backing: The stock's price stays above important rising moving averages (50-day, 100-day, and 200-day), which frequently serve as changing support levels in a good uptrend.
A good Technical Rating addresses the "which stock" question for a momentum investor. It selects for assets that are already moving and have shown they can perform better, a requirement before looking at any specific entry point.
Reviewing the Setup Condition
A firm trend by itself is not a buy signal; entering after a fast increase involves risk. This is where the Setup Quality Rating, which for HASI is a very good 9 out of 10, becomes important. It addresses the "when to buy" question by finding constructive price movement.
The report points out that HASI is showing a "acceptable setup pattern" marked by recent pause and lower price swings. In detail:
- Pause Pattern: The stock has been declining a little after a firm climb, a pattern frequently called a "bull flag." This rest lets the stock absorb its recent advances and form a new base of support.
- Clear Risk Limits: The setup notes specific technical levels. A close resistance area is between $34.00 and $34.37. A clear move above this area could indicate the next breakout stage. On the other hand, a firm support area is between $32.78 and $33.08, giving a sensible area to set a protective stop-loss order.
- Supportive Sign: The report also mentions a recent "Pocket Pivot" sign, a volume-based measure that hints at buying by bigger investors during the pause, adding a note of confirmation to the setup.
The high Setup Rating shows the stock is not overbought but is instead moving in a narrow range, offering a clear guide for both an entry trigger (a move above resistance) and an exit point (a move below support).
An Example Trading Plan
Using these ratings, the technical report presents a possible trading plan. It suggests an entry at $33.41, just above a key moving average, with a stop-loss at $32.77, just below the noted support area. This confines the example risk on the trade to about 1.9%. It is important to note that this is an automatic example for demonstration. Any trading choice must come from a person's own study, risk comfort, and knowledge of company-specific details like next earnings.
Locating Comparable Chances
HASI shows the kind of chance the Technical Breakout filter is made to find each day. For investors wanting to see the current list of stocks that meet these firm technical and setup rules, the filter is refreshed often. You can see the newest results by going to the Technical Breakout Setups page.
Disclaimer: This article is for information only and is not investment advice, a suggestion, or an offer to buy or sell any security. The examination uses technical measures and automatic reports. Investors should do their own research, think about their money situation and risk comfort, and talk with a qualified financial advisor before making any investment choices. Past results do not show future outcomes.