
Our stock screener has singled out HALOZYME THERAPEUTICS INC (NASDAQ:HALO) as an attractive growth opportunity. HALO is demonstrating remarkable growth potential while maintaining strong financial indicators, making it a reasonably priced option. We'll explore this further.
How do we evaluate the Growth for HALO?
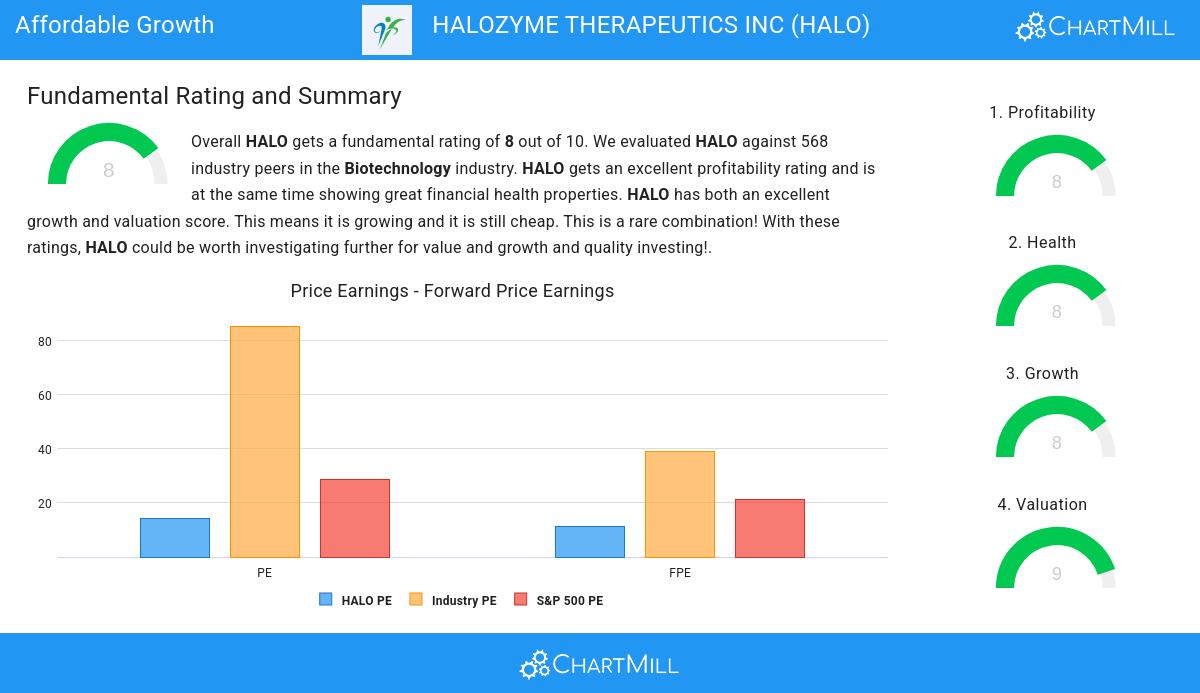
A key component of ChartMill's stock assessment is the Growth Rating, which spans from 0 to 10. This rating evaluates diverse growth factors, such as EPS and revenue growth, considering both past performance and future projections. HALO has received a 8 out of 10:
- The Earnings Per Share has grown by an impressive 52.16% over the past year.
- The Earnings Per Share has been growing by 30.12% on average over the past years. This is a very strong growth
- HALO shows a strong growth in Revenue. In the last year, the Revenue has grown by 22.46%.
- Measured over the past years, HALO shows a very strong growth in Revenue. The Revenue has been growing by 38.95% on average per year.
- Based on estimates for the next years, HALO will show a quite strong growth in Earnings Per Share. The EPS will grow by 16.06% on average per year.
- Based on estimates for the next years, HALO will show a quite strong growth in Revenue. The Revenue will grow by 11.27% on average per year.
Valuation Analysis for HALO
ChartMill provides a Valuation Rating to every stock, ranging from 0 to 10. This rating assesses various valuation aspects, comparing price to earnings and cash flows, while considering factors like profitability and growth. HALO boasts a 9 out of 10:
- HALO's Price/Earnings ratio is rather cheap when compared to the industry. HALO is cheaper than 96.83% of the companies in the same industry.
- HALO's Price/Earnings ratio indicates a rather cheap valuation when compared to the S&P500 average which is at 28.79.
- With a Price/Forward Earnings ratio of 11.46, the valuation of HALO can be described as very reasonable.
- Based on the Price/Forward Earnings ratio, HALO is valued cheaper than 96.65% of the companies in the same industry.
- Compared to an average S&P500 Price/Forward Earnings ratio of 21.38, HALO is valued a bit cheaper.
- 96.30% of the companies in the same industry are more expensive than HALO, based on the Enterprise Value to EBITDA ratio.
- Based on the Price/Free Cash Flow ratio, HALO is valued cheaply inside the industry as 96.13% of the companies are valued more expensively.
- The low PEG Ratio(NY), which compensates the Price/Earnings for growth, indicates a rather cheap valuation of the company.
- HALO has an outstanding profitability rating, which may justify a higher PE ratio.
- A more expensive valuation may be justified as HALO's earnings are expected to grow with 24.66% in the coming years.
Assessing Health Metrics for HALO
ChartMill employs a unique Health Rating system for all stocks. This rating, ranging from 0 to 10, is determined by analyzing various liquidity and solvency ratios. For HALO, the assigned 8 for health provides valuable insights:
- An Altman-Z score of 4.75 indicates that HALO is not in any danger for bankruptcy at the moment.
- HALO's Altman-Z score of 4.75 is amongst the best of the industry. HALO outperforms 80.46% of its industry peers.
- HALO has a debt to FCF ratio of 3.21. This is a good value and a sign of high solvency as HALO would need 3.21 years to pay back of all of its debts.
- HALO's Debt to FCF ratio of 3.21 is amongst the best of the industry. HALO outperforms 94.01% of its industry peers.
- HALO has a Current Ratio of 7.80. This indicates that HALO is financially healthy and has no problem in meeting its short term obligations.
- HALO has a better Current ratio (7.80) than 73.42% of its industry peers.
- A Quick Ratio of 6.78 indicates that HALO has no problem at all paying its short term obligations.
- HALO has a Quick ratio of 6.78. This is in the better half of the industry: HALO outperforms 67.96% of its industry peers.
Exploring HALO's Profitability
ChartMill's Profitability Rating offers a unique perspective on stock analysis, providing scores from 0 to 10. These ratings consider a wide range of profitability metrics and margins, both in comparison to industry peers and on their own merits. For HALO, the assigned 8 is a significant indicator of profitability:
- HALO has a better Return On Assets (21.52%) than 98.94% of its industry peers.
- The Return On Equity of HALO (122.06%) is better than 99.47% of its industry peers.
- With an excellent Return On Invested Capital value of 23.00%, HALO belongs to the best of the industry, outperforming 99.12% of the companies in the same industry.
- Measured over the past 3 years, the Average Return On Invested Capital for HALO is above the industry average of 14.25%.
- The last Return On Invested Capital (23.00%) for HALO is above the 3 year average (17.81%), which is a sign of increasing profitability.
- The Profit Margin of HALO (43.74%) is better than 99.12% of its industry peers.
- HALO has a Operating Margin of 54.32%. This is amongst the best in the industry. HALO outperforms 99.82% of its industry peers.
- The Gross Margin of HALO (84.30%) is better than 86.97% of its industry peers.
- In the last couple of years the Gross Margin of HALO has grown nicely.
More Affordable Growth stocks can be found in our Affordable Growth screener.
Check the latest full fundamental report of HALO for a complete fundamental analysis.
Keep in mind
Important Note: The content of this article is not intended as trading advice. It is essential to perform your own analysis and exercise caution when making trading decisions. The article presents observations created by automated analysis but does not guarantee any trading or investment outcomes. Always trade responsibly and make independent judgments.