
Here's HALOZYME THERAPEUTICS INC (NASDAQ:HALO) for you, a growth stock our stock screener believes is undervalued. HALO is scoring impressively in terms of growth while demonstrating strong financials. On top of that, it remains attractively priced. Let's break it down further.
A Closer Look at Growth for HALO
ChartMill employs its own Growth Rating system for all stocks. This score, ranging from 0 to 10, is derived by evaluating different growth factors, such as EPS and revenue growth, taking into account both past performance and future projections. HALO has earned a 8 for growth:
- HALO shows a strong growth in Earnings Per Share. In the last year, the EPS has been growing by 52.16%, which is quite impressive.
- The Earnings Per Share has been growing by 30.12% on average over the past years. This is a very strong growth
- HALO shows a strong growth in Revenue. In the last year, the Revenue has grown by 22.46%.
- HALO shows a strong growth in Revenue. Measured over the last years, the Revenue has been growing by 38.95% yearly.
- The Earnings Per Share is expected to grow by 15.58% on average over the next years. This is quite good.
- The Revenue is expected to grow by 10.99% on average over the next years. This is quite good.
How We Gauge Valuation for HALO
To assess a stock's valuation, ChartMill utilizes a Valuation Rating on a scale of 0 to 10. This comprehensive assessment considers various valuation aspects, comparing price to earnings and cash flows, while factoring in profitability and growth. HALO has achieved a 8 out of 10:
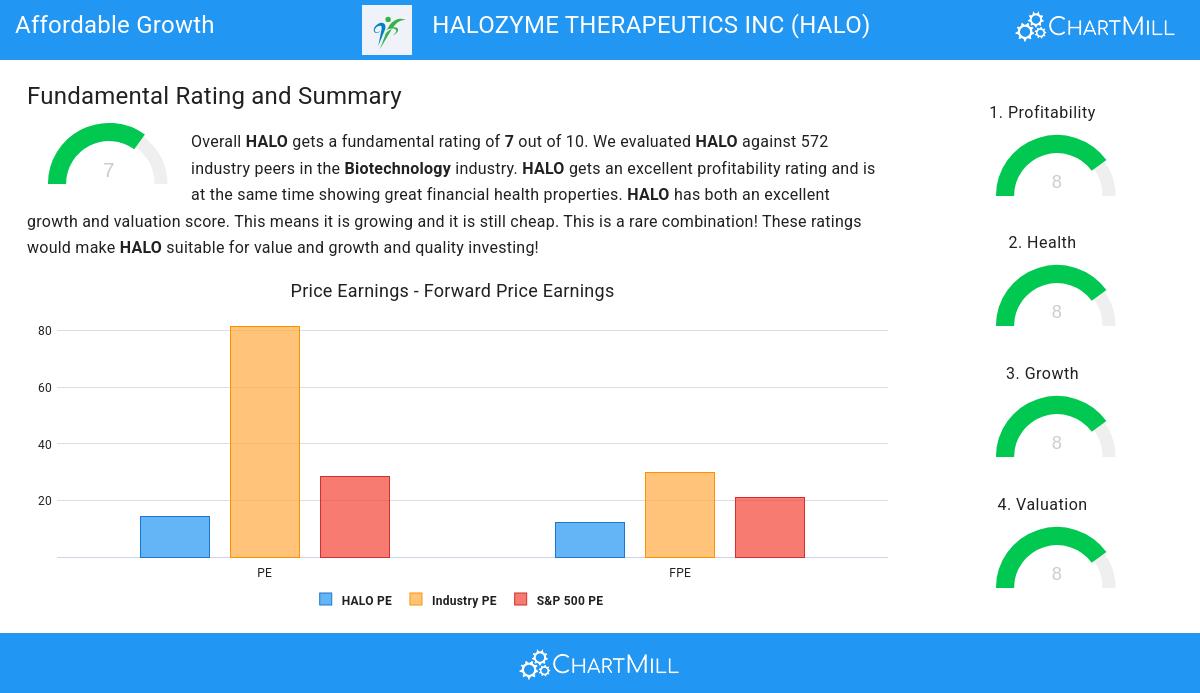
- 97.03% of the companies in the same industry are more expensive than HALO, based on the Price/Earnings ratio.
- The average S&P500 Price/Earnings ratio is at 28.38. HALO is valued slightly cheaper when compared to this.
- Compared to the rest of the industry, the Price/Forward Earnings ratio of HALO indicates a rather cheap valuation: HALO is cheaper than 96.85% of the companies listed in the same industry.
- When comparing the Price/Forward Earnings ratio of HALO to the average of the S&P500 Index (21.15), we can say HALO is valued slightly cheaper.
- Based on the Enterprise Value to EBITDA ratio, HALO is valued cheaper than 96.50% of the companies in the same industry.
- HALO's Price/Free Cash Flow ratio is rather cheap when compared to the industry. HALO is cheaper than 96.68% of the companies in the same industry.
- HALO's low PEG Ratio(NY), which compensates the Price/Earnings for growth, indicates a rather cheap valuation of the company.
- HALO has an outstanding profitability rating, which may justify a higher PE ratio.
- A more expensive valuation may be justified as HALO's earnings are expected to grow with 23.98% in the coming years.
How We Gauge Health for HALO
To gauge a stock's financial health, ChartMill utilizes a Health Rating on a scale of 0 to 10. This comprehensive evaluation encompasses liquidity and solvency, both in absolute terms and in comparison to industry peers. HALO has earned a 8 out of 10:
- An Altman-Z score of 4.82 indicates that HALO is not in any danger for bankruptcy at the moment.
- Looking at the Altman-Z score, with a value of 4.82, HALO belongs to the top of the industry, outperforming 80.24% of the companies in the same industry.
- The Debt to FCF ratio of HALO is 3.21, which is a good value as it means it would take HALO, 3.21 years of fcf income to pay off all of its debts.
- HALO's Debt to FCF ratio of 3.21 is amongst the best of the industry. HALO outperforms 93.88% of its industry peers.
- A Current Ratio of 7.80 indicates that HALO has no problem at all paying its short term obligations.
- With a decent Current ratio value of 7.80, HALO is doing good in the industry, outperforming 72.90% of the companies in the same industry.
- HALO has a Quick Ratio of 6.78. This indicates that HALO is financially healthy and has no problem in meeting its short term obligations.
- With a decent Quick ratio value of 6.78, HALO is doing good in the industry, outperforming 67.48% of the companies in the same industry.
Understanding HALO's Profitability
ChartMill assigns a proprietary Profitability Rating to each stock. The score is computed by evaluating various profitability ratios and margins and ranges from 0 to 10. HALO was assigned a score of 8 for profitability:
- Looking at the Return On Assets, with a value of 21.52%, HALO belongs to the top of the industry, outperforming 98.78% of the companies in the same industry.
- HALO has a Return On Equity of 122.06%. This is amongst the best in the industry. HALO outperforms 99.48% of its industry peers.
- HALO has a better Return On Invested Capital (23.00%) than 98.60% of its industry peers.
- Measured over the past 3 years, the Average Return On Invested Capital for HALO is above the industry average of 14.62%.
- The 3 year average ROIC (17.81%) for HALO is below the current ROIC(23.00%), indicating increased profibility in the last year.
- The Profit Margin of HALO (43.74%) is better than 99.13% of its industry peers.
- HALO has a Operating Margin of 54.32%. This is amongst the best in the industry. HALO outperforms 99.83% of its industry peers.
- HALO has a better Gross Margin (84.30%) than 87.76% of its industry peers.
- HALO's Gross Margin has improved in the last couple of years.
More Affordable Growth stocks can be found in our Affordable Growth screener.
Check the latest full fundamental report of HALO for a complete fundamental analysis.
Keep in mind
This article should in no way be interpreted as advice. The article is based on the observed metrics at the time of writing, but you should always make your own analysis and trade or invest at your own responsibility.