
For investors who use charts and price action to guide their choices, a methodical way to find possible opportunities is important. One approach looks for stocks that are both technically sound and making a constructive price pattern, a pairing that can indicate a preparation for a new move upward. This method centers on two specific metrics: the ChartMill Technical Rating, which measures the general condition and direction of a stock, and the ChartMill Setup Quality Rating, which judges if the stock's present price action shows a clear and lower-risk entry point. By sorting for stocks that rate well on both measures, traders try to find breakout possibilities within the market's leading names.
HALLIBURTON CO (NYSE:HAL) recently appeared from such a search, showing a profile that calls for more examination from a technical viewpoint. As a major provider of products and services to the global energy industry, its stock's movements are often linked to oilfield activity and wider energy sector trends. The present technical view, however, indicates the stock may be forming its own course.
Examining the Technical Base
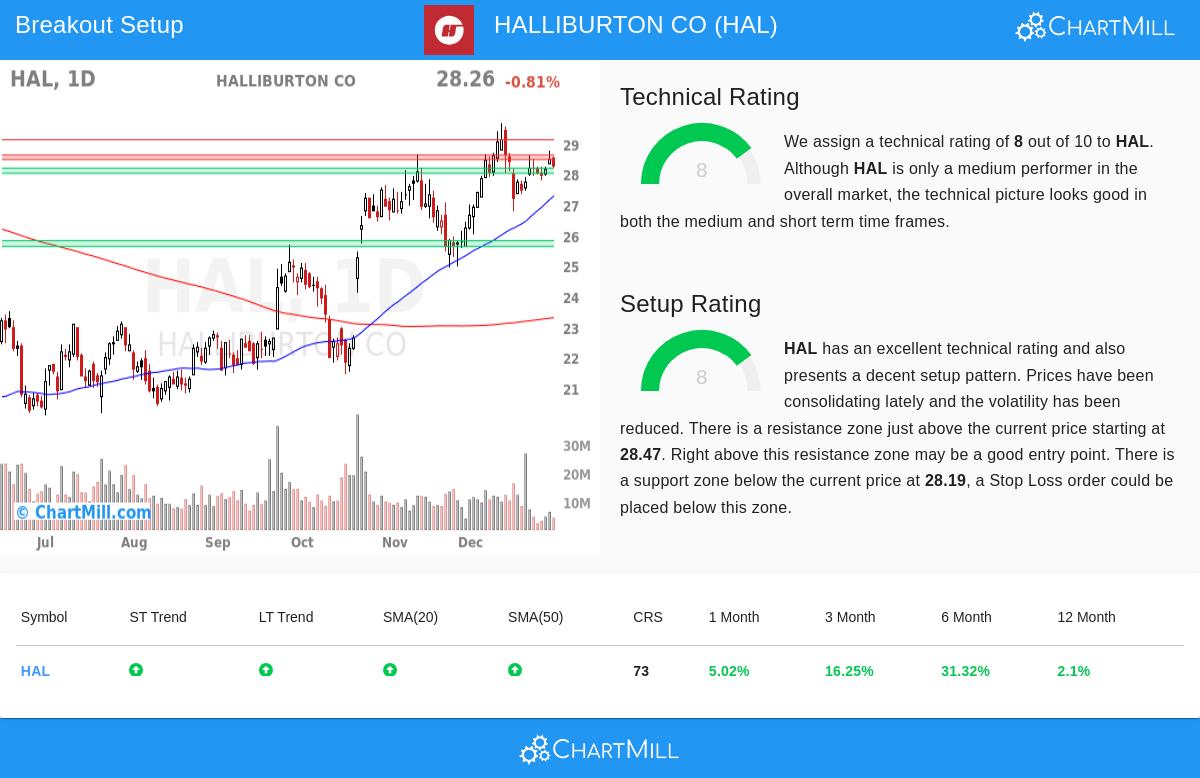
The main filter in a breakout search is a stock's foundational technical soundness. A high ChartMill Technical Rating shows a sound and steady trend, which is important because breaking out from a position of soundness is usually more forceful and lasting than from a weak foundation. For HAL, the technical rating is a firm 8 out of 10, putting it clearly in uptrend ground.
A look at the full technical report shows the supports for this score:
- Trend Agreement: Both the long-term and short-term trends for HAL are rated as positive. This agreement across time periods is a good sign, pointing to coordinated buying pressure.
- Moving Average Backing: The stock is trading above all its main simple moving averages (20, 50, 100, and 200-day), and each of these averages is itself in a rising pattern. This layered positive agreement shows continued upward momentum.
- Relative Performance: While HAL is doing better than 73% of the whole market over the last year, the report states this soundness is fairly new. More significantly, it is presently trading in the higher part of its own 52-week range.
This mix describes a stock in a verified uptrend, meeting the basic "which stock" need for technical investors by showing confirmed soundness.
Judging the Setup Quality
A steady trend by itself is not a buy signal; entering at a poor point in a trend can cause quick losses. This is where the Setup Quality Rating becomes vital. It addresses the "when" question by finding times of consolidation or tight trading ranges inside the wider trend. These pauses often come before the next directional move. HAL's Setup Rating is also an 8, pointing to a possibly interesting entry formation.
The technical report lists the features of this setup:
- Consolidation Area: Over the last month, HAL has traded in a band between about $26.79 and $29.66. It is now placed in the middle of this band, after a time where price action has narrowed and volatility has fallen, a typical pre-breakout contraction.
- Clear Risk Limits: The study finds definite support and resistance areas, which are basic for planning a trade.
- Resistance: A main area sits between $28.47 and $28.62. A clear move above this zone could indicate a breakout and the start of a new upward stage.
- Support: Several support layers exist below, with the closest important zone going from $28.02 to $28.19. This gives a sensible area to set a protective stop-loss order, setting the risk of the trade.
The report combines this into a particular, though automated, trade idea: an entry on a breakout above $28.63 (just above resistance) with a stop-loss below $28.01 (just below support). This shows how the setup quality measure changes into a concrete, rules-based trading plan with a preset risk level.
Summary and Next View
HALLIBURTON CO presents an interesting case for technical investors using a breakout method. It meets the two needs of the method: a high Technical Rating confirms it is a market leader in a steady uptrend, while a high Setup Rating shows it is coming out of a consolidation, giving a clear and measurable entry trigger. The set support and resistance levels allow for simple trade management. As usual, traders should think about this technical setting next to fundamental factors and wider market conditions, like the present positive trends in the S&P 500, which can give a supportive environment for breakout moves.
Interested in finding more possible breakout setups like HAL? Our daily Technical Breakout Setups screen is refreshed often to search the market for similar possibilities. You can view the present results and run your own filters via this link.
Disclaimer: This article is for informational purposes only and does not constitute financial advice, a recommendation, or an offer or solicitation to buy or sell any securities. The analysis presented is based on technical metrics and should not be the sole basis for an investment decision. All trading and investment decisions involve risk, including the risk of loss. Past performance is not indicative of future results. Always conduct your own research and consider consulting with a qualified financial advisor before making any investment decisions.