
For technical investors, identifying stocks that are both in a strong trend and ready for a continuation move is a central part of momentum-based strategies. One methodical approach involves looking for securities that show solid underlying technical condition while also trading in a tight pattern, indicating a possible breakout is near. This method uses two key proprietary metrics from ChartMill: the Technical Rating, which measures the overall strength and trend of a stock, and the Setup Quality Rating, which evaluates the condition of its current trading pattern. A stock with high scores on both presents a strong case for traders seeking high-probability breakout chances.
A recent search for such technical breakout patterns has identified Halliburton Co (NYSE:HAL) as a leading example. As a top provider of products and services to the global energy industry, Halliburton's stock performance is linked to oilfield activity. The company's technical condition, however, is currently telling its own story, separate from wider market themes.
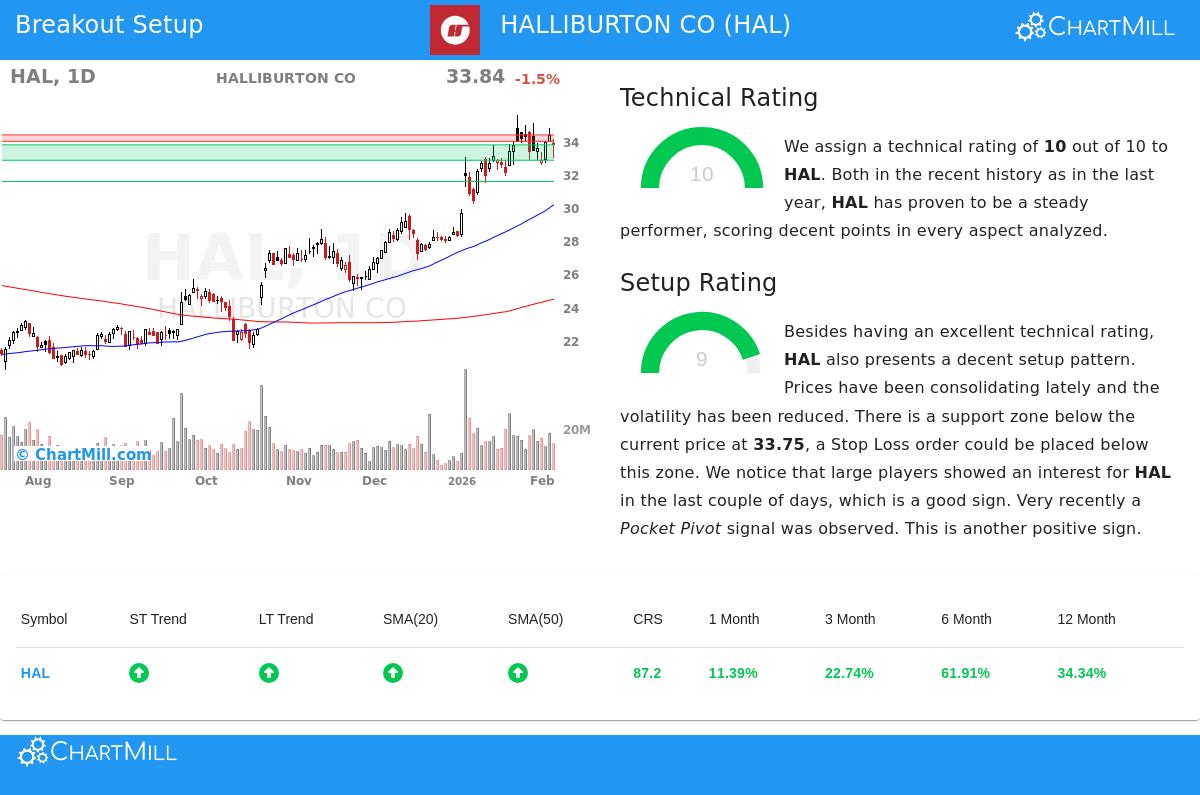
A Base of Outstanding Technical Condition
The main requirement in a breakout search looks for stocks with a high Technical Rating, confirming the underlying trend is forceful and lasting. Halliburton performs well here, having a perfect rating of 10 out of 10. This highest score is given carefully; it comes from a full review of multiple timeframes and trend indicators. An examination of the full technical report shows the reasons for this condition:
- Trend Agreement: Both the short-term and long-term trends for HAL are rated as positive. This agreement across timeframes is a strong signal, showing coordinated buying from different investor time horizons.
- Strong Relative Performance: Over the last year, HAL has done better than 87% of all stocks in the market. This notable relative performance shows the stock is a frontrunner, not just taking part in any wider rise.
- Positive Moving Average Arrangement: The stock is trading above all its important moving averages (20, 50, 100, and 200-day), and each of these averages is itself in a rising pattern. This layered, rising support formation is a typical sign of a solid uptrend.
This solid technical base is important for the strategy. A breakout from a weak stock often fails quickly. A breakout from a stock already showing leadership and momentum, like HAL, has a much greater chance of leading to a continued rise.
A High-Condition Pattern for a Possible Breakout
While a solid trend is needed, it is not enough for a best entry. Buying a stock that has risen a lot can lead to quick declines. This is where the Setup Quality Rating becomes important, finding periods of sideways movement or "tightness" within the existing trend. Halliburton scores a 9 out of 10 on this measure, pointing to a very good pattern.
The technical report explains why this pattern is forming:
- Sideways Movement and Lower Volatility: After a notable rise, the stock has been trading in a sideways range over the last month. This pause lets the moving averages move closer and creates a base of support for the next possible step higher.
- Defined Support and Resistance: The analysis finds a clear support area between $32.82 and $33.75, made by a combination of trendlines and moving averages. Just above, a resistance area is between $33.96 and $34.35. This makes a clear area where a decisive move above resistance could indicate a breakout.
- Favorable Market Behavior: The report mentions positive signs from market participants, including attention from large investors and a recent "Pocket Pivot", a volume-based sign that often points to accumulation during a sideways phase.
For a trader, this high-condition pattern means a clear, rules-based situation. It gives a logical entry point just above the specified resistance (proposed at $34.36) and a close stop-loss level just below the support area (proposed at $32.81), allowing for a managed, calculated risk.
Conclusion and View
Halliburton shows a classic example for technical investors using a breakout method. It joins the uncommon achievement of a perfect Technical Rating, verifying its position as a market frontrunner in a forceful uptrend, with a very good Setup Quality Rating, pointing to a constructive pause within that trend. This pairing indicates the stock is not only strong, but also possibly getting ready for its next important move.
It is necessary to recall that technical patterns show likelihoods, not guarantees. The identified resistance level must be clearly passed on volume for a true breakout to be verified. Also, as an energy services company, HAL stays reactive to macroeconomic factors and commodity price changes, which should be thought about next to the technical view.
For investors curious about finding other stocks currently showing similar technical signs, new breakout examples are found daily through the Technical Breakout Setups search.
Disclaimer: This article is for informational purposes only and does not constitute investment advice, a recommendation, or an offer or solicitation to buy or sell any securities. The analysis is based on technical indicators and historical data, which are not guarantees of future performance. All trading and investment decisions involve risk, and you should conduct your own research and consult with a qualified financial advisor before making any decisions.