
Investors looking to find companies with both good business momentum and positive price movement often use a mix of technical and fundamental analysis. One method looks for stocks with good growth basics—such as increasing earnings and sales—while also showing sound financial condition and profit. This fundamental quality is then combined with a technical analysis step that finds stocks building consolidation patterns, indicating a possible breakout might be near. This approach tries to find companies that are not only expanding more quickly than others but are also at a technical turning point, possibly giving a good entry point for price gains.
FORTINET INC (NASDAQ:FTNT) comes up as a result from this kind of screening. The cybersecurity company, recognized for its unified Fortinet Security Fabric platform, seems to fit the main ideas of this growth-and-setup method.
Fundamental Quality: The Driver for Expansion
The main attraction of Fortinet is its very good fundamental results, which are important for any lasting growth investment. A look at the company's fundamental analysis report shows high marks across important growth and quality measures. The company's growth score of 8/10 is backed by notable past trends and firm future outlooks.
- High Profitability: Fortinet gets a top-level profitability score of 9/10. Important margins are best in class, with a Return on Invested Capital (ROIC) of 38.77%, doing better than almost 99% of its software industry competitors. A high Gross Margin of 80.86% highlights the efficiency of its platform-based business.
- Steady and Good Expansion: The company has shown forceful, steady growth:
- Earnings Per Share (EPS) has increased at an average yearly rate of 36.84% over recent years.
- Sales have risen at an average yearly rate of 22.46%.
- While future growth projections are more measured, they remain good, with expected yearly EPS growth of 9.01% and sales growth of 12.42%.
- Firm Financial Condition: With a health score of 7/10, Fortinet keeps a solid balance sheet. Its Altman-Z score points to low bankruptcy risk, and its debt is very well covered by free cash flow. While current and quick ratios seem low, the report explains this in view of the company's very good solvency and profitability, suggesting it may not point to day-to-day cash flow problems.
This mix of high profitability, good past growth, and financial strength is exactly what growth investors look for. It points to a company with a competitive advantage, efficient activities, and the ability to pay for its own growth—traits that can help long-term share price increases.
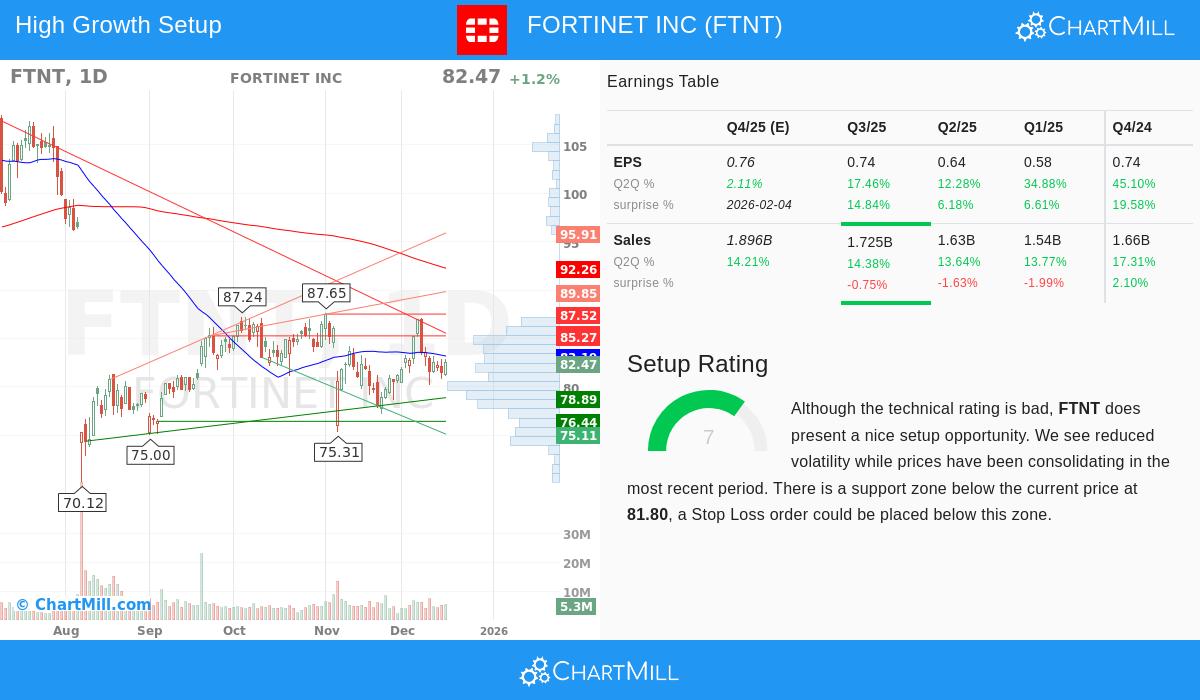
Technical Pattern: A Period of Consolidation
While fundamentals give the "why," technical analysis can help with the "when." Fortinet's recent price movement shows the sort of pattern that frequently comes before a notable move. Based on its technical analysis report, the stock is given a low overall technical score (1/10) because of its longer-term downward trend and weaker performance compared to the wider market over the past year. However, more applicable for this method is its setup score of 7/10.
The report states that the stock has been consolidating in a band between about $77 and $87 over the last month, showing less price movement. This time of balance often happens before a clear price move. The stock is now trading near the middle of this band, with a clear support area found just below the current price around $81.80. For chart analysts, a continued move above the recent consolidation resistance could mark the start of a new upward period, especially if joined by high trading volume.
This technical situation is important for the combined method. It aims to find fundamentally good stocks that are not necessarily in a strong upward trend but are instead pausing or forming a base after a drop. The thought is that the basic business quality stays unchanged, and the technical consolidation shows a time of gathering before the next move up.
Valuation and Market Setting
Valuation is a key factor, as even the best growth companies can be bad investments if bought at very high prices. Fortinet's valuation score is a neutral 4/10. Its Price-to-Earnings (P/E) ratio of 30.54 is about equal to the current S&P 500 average and is actually priced lower than a large part of its software industry competitors. While not low-priced, this fair valuation relative to its own industry, together with its better growth and profitability, can be viewed as an acceptable premium for quality.
It is important to see that the stock's poor longer-term technical trend lines up with a time where the S&P 500 has been reaching new highs, emphasizing its recent relative weakness. However, for the screening method discussed, this weaker performance is part of the pattern, creating a possible chance if the fundamental story stays attractive and the technical base is finished.
Conclusion
Fortinet shows a situation where a good fundamental growth story meets a technical chart pattern indicating a possible turning point. The company's top-level profitability, steady high growth, and firm financial condition build a solid base for long-term investors. At the same time, its recent price consolidation gives a clear technical structure for those searching for a positive entry pattern.
This meeting of criteria—good growth fundamentals with a fair technical pattern—is the core of the screening approach, trying to find companies where business momentum and price momentum might be ready to come together.
Interested in looking at other stocks that fit this profile of good growth combined with a positive technical pattern? You can find more possible choices by checking the Strong Growth Stock Technical Setups screen.
,
Disclaimer: This article is for informational purposes only and does not constitute financial advice, a recommendation, or an offer or solicitation to buy or sell any securities. The analysis presented is based on data and reports provided by third parties. Investing involves risk, including the potential loss of principal. You should conduct your own research and consult with a qualified financial advisor before making any investment decisions.