
In the world of equity investing, combining different analytical disciplines can often provide a more complete framework for identifying opportunities. One such approach is to screen for companies that exhibit strong basic business qualities, specifically, solid growth, profitability, and financial condition, while also presenting a positive technical chart pattern indicating a possible breakout. This method aims to align the qualitative promise of a company's operations with the quantitative momentum signals from market price action. A security that recently appeared from such a multi-factor screen is FORTINET INC (NASDAQ:FTNT), a major participant in the cybersecurity field.
Fundamental Strength: The Base of Growth
The first part of this screening strategy is fundamental strength, which for Fortinet is notably positive. According to a full fundamental analysis, the company receives an overall rating of 7 out of 10, with especially high scores in profitability (9) and financial health (8). For a growth-oriented strategy, these are important indicators. Strong profitability suggests the company can efficiently convert revenue into earnings, which fuels reinvestment and shareholder returns, while sound financial health implies stability and a lower chance of financial trouble.
- High Profitability: Fortinet's metrics are notable, particularly within the competitive software industry.
- A Return on Invested Capital (ROIC) of 32.34% puts it in the top 3% of its peers, showing very efficient use of capital.
- Its Profit Margin of 27.26% and Operating Margin of 30.51% are also with the best in its sector.
- Sound Financial Health: The company keeps a firm balance sheet, a main factor for continuing growth plans.
- It has a good Altman-Z score of 5.39, indicating low bankruptcy risk.
- Its debt levels are reasonable, with a Debt-to-Free-Cash-Flow ratio of 0.45, meaning it could pay off all debt in under six months with its current cash flow.
- Clear Growth Path: The growth rating of 7 is backed by a firm historical record.
- Revenue has increased at an average yearly rate of over 21% in recent years, with EPS growth averaging close to 33%.
- While future EPS growth estimates are more measured, revenue is still projected to increase at a good 11.54% yearly.
This fundamental picture is necessary for the strategy because it finds a company not only increasing quickly, but doing so profitably and from a state of financial firmness. This lessens the speculative quality often linked with pure growth investing.
Technical Setup: Aligning Price with Possibility
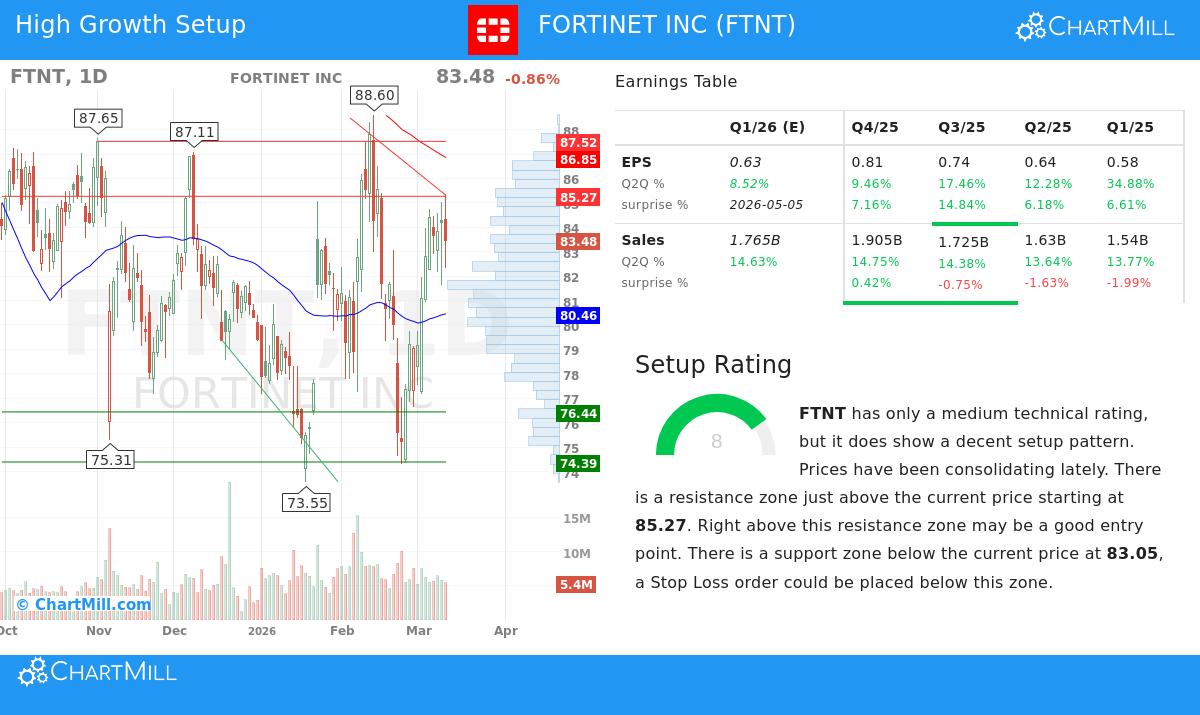
The second part involves finding a positive technical setup that indicates building investor interest and a possible breakout from a period of sideways movement. Fortinet's technical analysis report points out such an opportunity, giving it a setup rating of 8 out of 10, even with a medium overall technical rating of 4.
The chart shows Fortinet in a period of sideways movement after a large decline from its 52-week highs. Lately, however, the short-term trend has improved while the long-term trend is neutral, hinting at a possible turning point. The analysis mentions a clear resistance area just above the present price, beginning near $85.27. A clear move above this area could mark the start of a new upward phase, providing a possible entry point for momentum investors. The existence of defined support levels below gives a logical area for setting stop-loss orders, aiding in risk management. This technical view is exactly what the screening method looks for: a stock with firm fundamentals that is starting to show signs of technical improvement after a time of basing or sideways movement.
Combination: A Meeting of Signals
Fortinet presents a case where fundamental and technical analyses come together to tell a unified story. Fundamentally, it is a frontrunner in the necessary and growing cybersecurity market, showing top-tier profitability, firm health, and a tested growth model. Technically, it is coming out of a sideways phase with a set breakout level above. This pairing is the center of the described strategy, it tries to find companies where improving market mood (as seen in the price chart) is supported by a lasting and high-quality business foundation (as seen in the financial statements).
For investors curious about finding other companies that fit this specific mix of firm growth fundamentals and positive technical setups, more results can be found using the Strong Growth Stocks with good Technical Setup Ratings screen.
Disclaimer: This article is for informational purposes only and does not constitute investment advice, a recommendation, or an offer to buy or sell any security. The analysis is based on data and reports available at the time of writing. Investors should conduct their own research and consider their individual financial circumstances and risk tolerance before making any investment decisions. Past performance is not indicative of future results.