
For growth-minded investors, high revenue and EPS growth are key criteria. Today, we'll examine whether FORTINET INC (NASDAQ:FTNT) fits the bill for growth investing, particularly as it forms a base and hints at a potential breakout. Remember, due diligence is essential, but FORTINET INC has caught our attention on our screen for growth with base formation. It may warrant additional investigation.
ChartMill's Evaluation of Growth
ChartMill employs its own Growth Rating system for all stocks. This score, ranging from 0 to 10, is derived by evaluating different growth factors, such as EPS and revenue growth, taking into account both past performance and future projections. NASDAQ:FTNT has earned a 8 for growth:
- The Earnings Per Share has grown by an impressive 44.51% over the past year.
- FTNT shows a strong growth in Earnings Per Share. Measured over the last years, the EPS has been growing by 36.84% yearly.
- FTNT shows quite a strong growth in Revenue. In the last year, the Revenue has grown by 12.27%.
- FTNT shows a strong growth in Revenue. Measured over the last years, the Revenue has been growing by 22.46% yearly.
- The Earnings Per Share is expected to grow by 16.56% on average over the next years. This is quite good.
- The Revenue is expected to grow by 13.41% on average over the next years. This is quite good.
A Closer Look at Health for NASDAQ:FTNT
A critical element of ChartMill's stock evaluation is the Health Rating, which spans from 0 to 10. This rating considers multiple health factors, including liquidity and solvency, both in absolute terms and relative to industry peers. NASDAQ:FTNT has received a 8 out of 10:
- FTNT has an Altman-Z score of 7.39. This indicates that FTNT is financially healthy and has little risk of bankruptcy at the moment.
- The Altman-Z score of FTNT (7.39) is better than 76.00% of its industry peers.
- FTNT has a debt to FCF ratio of 0.53. This is a very positive value and a sign of high solvency as it would only need 0.53 years to pay back of all of its debts.
- FTNT has a Debt to FCF ratio of 0.53. This is in the better half of the industry: FTNT outperforms 75.64% of its industry peers.
- Even though the debt/equity ratio score it not favorable for FTNT, it has very limited outstanding debt, so we won't put too much weight on the DE evaluation.
- The current and quick ratio evaluation for FTNT is rather negative, while it does have excellent solvency and profitability. These ratios do not necessarly indicate liquidity issues and need to be evaluated against the specifics of the business.
Evaluating Profitability: NASDAQ:FTNT
ChartMill assigns a Profitability Rating to every stock. This score ranges from 0 to 10 and evaluates the different profitability ratios and margins, both absolutely, but also relative to the industry peers. NASDAQ:FTNT scores a 9 out of 10:
- Looking at the Return On Assets, with a value of 17.88%, FTNT belongs to the top of the industry, outperforming 94.91% of the companies in the same industry.
- Looking at the Return On Equity, with a value of 116.83%, FTNT belongs to the top of the industry, outperforming 98.91% of the companies in the same industry.
- The Return On Invested Capital of FTNT (27.67%) is better than 97.45% of its industry peers.
- Measured over the past 3 years, the Average Return On Invested Capital for FTNT is significantly above the industry average of 11.97%.
- Looking at the Profit Margin, with a value of 29.30%, FTNT belongs to the top of the industry, outperforming 93.45% of the companies in the same industry.
- FTNT's Profit Margin has improved in the last couple of years.
- Looking at the Operating Margin, with a value of 30.20%, FTNT belongs to the top of the industry, outperforming 94.55% of the companies in the same industry.
- FTNT's Operating Margin has improved in the last couple of years.
- With an excellent Gross Margin value of 80.56%, FTNT belongs to the best of the industry, outperforming 82.18% of the companies in the same industry.
How does the Setup look for NASDAQ:FTNT
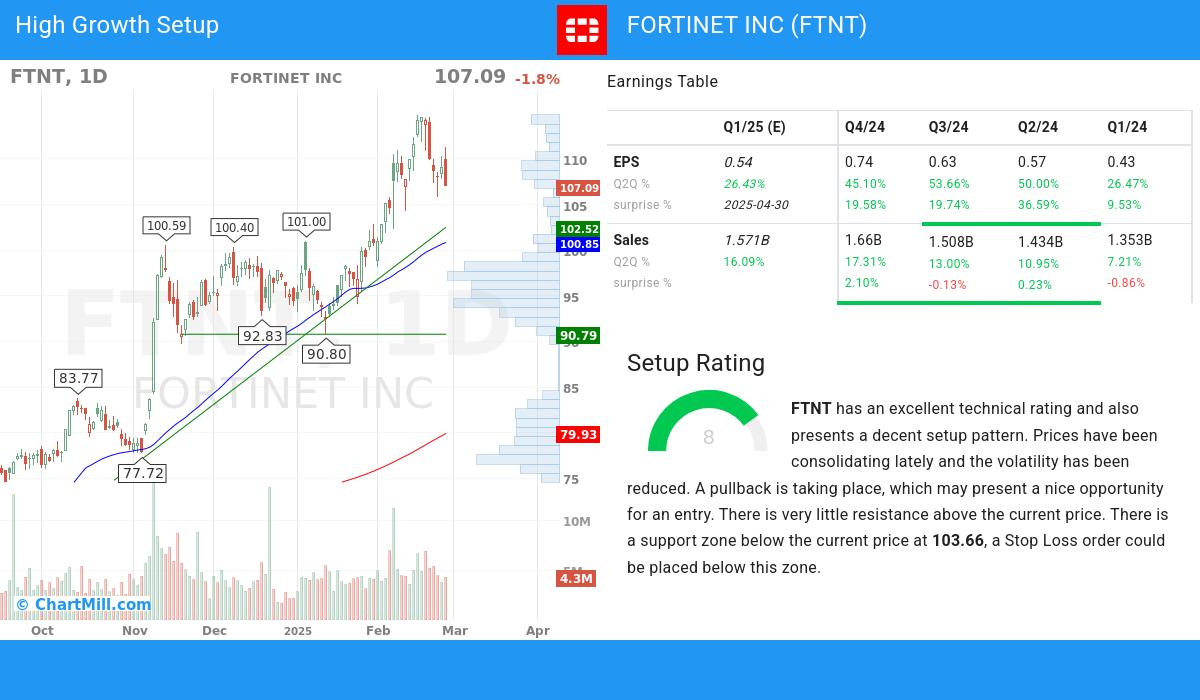
Next to the Technical Rating, the Setup Rating of a stock determines to which extend the stock is consolidating. This score also ranges from 0 to 10 and is updated daily. The setup score evaluates various short term technical indicators. For NASDAQ:FTNT this score is currently 8:
FTNT has an excellent technical rating and also presents a decent setup pattern. Prices have been consolidating lately and the volatility has been reduced. A pullback is taking place, which may present a nice opportunity for an entry. There is very little resistance above the current price. There is a support zone below the current price at 103.66, a Stop Loss order could be placed below this zone.
More Strong Growth stocks can be found in our Strong Growth screener.
For an up to date full fundamental analysis you can check the fundamental report of FTNT
For an up to date full technical analysis you can check the technical report of FTNT
Disclaimer
This article should in no way be interpreted as advice. The article is based on the observed metrics at the time of writing, but you should always make your own analysis and trade or invest at your own responsibility.