
In this article we will dive into FORTINET INC (NASDAQ:FTNT) as a possible candidate for growth investing. Investors should always do their own research, but we noticed FORTINET INC showing up in our strong growth, ready to breakout screen, which makes it worth to investigate a bit more.
Understanding NASDAQ:FTNT's Growth Score
ChartMill assigns a Growth Rating to every stock. This score ranges from 0 to 10 and evaluates the different growth aspects like EPS and Revenue, both in the past as in the future. NASDAQ:FTNT scores a 8 out of 10:
- FTNT shows a strong growth in Earnings Per Share. In the last year, the EPS has been growing by 36.31%, which is quite impressive.
- FTNT shows a strong growth in Earnings Per Share. Measured over the last years, the EPS has been growing by 35.13% yearly.
- Looking at the last year, FTNT shows a quite strong growth in Revenue. The Revenue has grown by 10.40% in the last year.
- Measured over the past years, FTNT shows a very strong growth in Revenue. The Revenue has been growing by 24.11% on average per year.
- FTNT is expected to show quite a strong growth in Earnings Per Share. In the coming years, the EPS will grow by 16.86% yearly.
- Based on estimates for the next years, FTNT will show a quite strong growth in Revenue. The Revenue will grow by 13.94% on average per year.
Understanding NASDAQ:FTNT's Health
ChartMill employs its own Health Rating for stock assessment. This rating, ranging from 0 to 10, is calculated by examining various liquidity and solvency ratios. In the case of NASDAQ:FTNT, the assigned 6 reflects its health status:
- An Altman-Z score of 6.99 indicates that FTNT is not in any danger for bankruptcy at the moment.
- The Altman-Z score of FTNT (6.99) is better than 72.40% of its industry peers.
- The Debt to FCF ratio of FTNT is 0.60, which is an excellent value as it means it would take FTNT, only 0.60 years of fcf income to pay off all of its debts.
- The Debt to FCF ratio of FTNT (0.60) is better than 76.34% of its industry peers.
- Although FTNT does not score too well on debt/equity it has very limited outstanding debt, which is well covered by the FCF. We will not put too much weight on the debt/equity number as it may be because of low equity, which could be a consequence of a share buyback program for instance. This needs to be investigated.
How do we evaluate the Profitability for NASDAQ:FTNT?
ChartMill employs its own Profitability Rating system for stock evaluation. This score, ranging from 0 to 10, is derived from an analysis of diverse profitability metrics and margins. In the case of NASDAQ:FTNT, the assigned 9 is noteworthy for profitability:
- The Return On Assets of FTNT (17.28%) is better than 93.55% of its industry peers.
- FTNT's Return On Equity of 168.47% is amongst the best of the industry. FTNT outperforms 99.64% of its industry peers.
- FTNT has a better Return On Invested Capital (25.60%) than 96.06% of its industry peers.
- The Average Return On Invested Capital over the past 3 years for FTNT is significantly above the industry average of 12.22%.
- The 3 year average ROIC (21.99%) for FTNT is below the current ROIC(25.60%), indicating increased profibility in the last year.
- FTNT has a Profit Margin of 26.79%. This is amongst the best in the industry. FTNT outperforms 92.83% of its industry peers.
- FTNT's Profit Margin has improved in the last couple of years.
- FTNT's Operating Margin of 28.19% is amongst the best of the industry. FTNT outperforms 93.91% of its industry peers.
- FTNT's Operating Margin has improved in the last couple of years.
- FTNT has a Gross Margin of 79.71%. This is in the better half of the industry: FTNT outperforms 77.78% of its industry peers.
Why is NASDAQ:FTNT a setup?
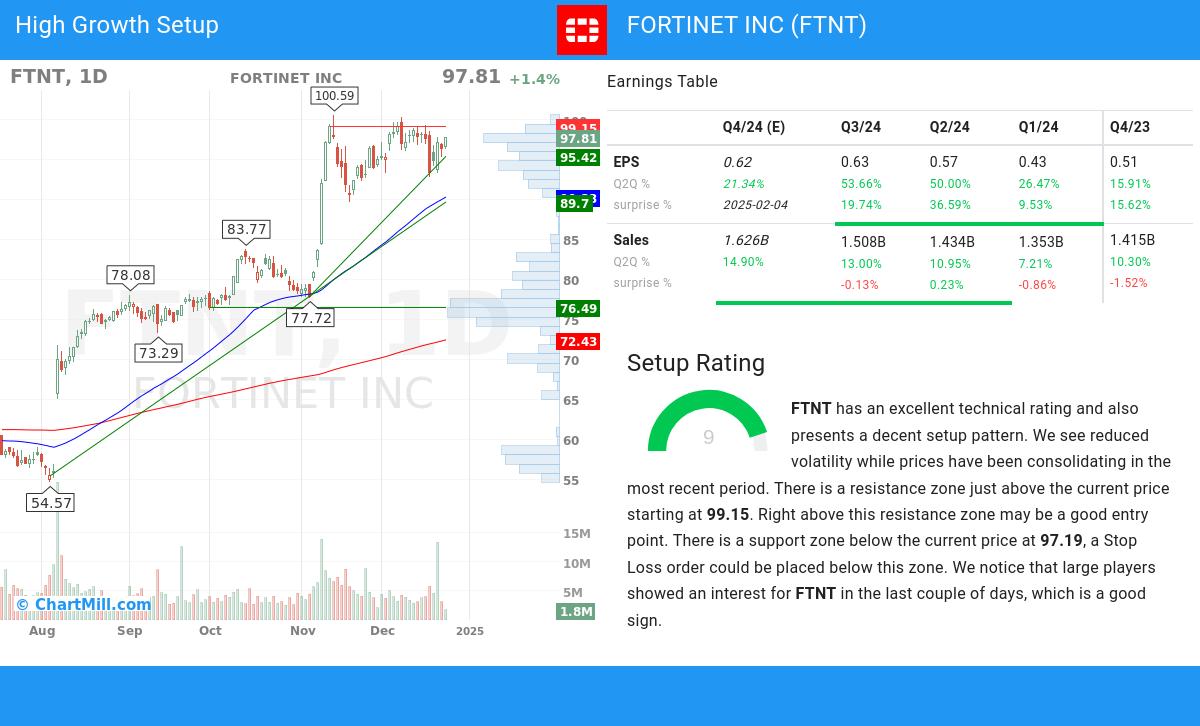
ChartMill also assign a Setup Rating to every stock. With this score it is determined to what extend the stock has been trading in a range in the recent days and weeks. This score also ranges from 0 to 10 and is updated daily. The setup score evaluates various short term technical indicators. NASDAQ:FTNT scores a 9 out of 10:
FTNT has an excellent technical rating and also presents a decent setup pattern. We see reduced volatility while prices have been consolidating in the most recent period. There is a resistance zone just above the current price starting at 99.15. Right above this resistance zone may be a good entry point. There is a support zone below the current price at 97.19, a Stop Loss order could be placed below this zone. We notice that large players showed an interest for FTNT in the last couple of days, which is a good sign.
Every day, new Strong Growth stocks can be found on ChartMill in our Strong Growth screener.
Our latest full fundamental report of FTNT contains the most current fundamental analsysis.
Our latest full technical report of FTNT contains the most current technical analsysis.
Keep in mind
This is not investing advice! The article highlights some of the observations at the time of writing, but you should always make your own analysis and invest based on your own insights.