
In this article we will dive into FORTINET INC (NASDAQ:FTNT) as a possible candidate for growth investing. Investors should always do their own research, but we noticed FORTINET INC showing up in our strong growth, ready to breakout screen, which makes it worth to investigate a bit more.
What does the Growth looks like for NASDAQ:FTNT
A key component of ChartMill's stock assessment is the Growth Rating, which spans from 0 to 10. This rating evaluates diverse growth factors, such as EPS and revenue growth, considering both past performance and future projections. NASDAQ:FTNT has received a 8 out of 10:
- FTNT shows a strong growth in Earnings Per Share. In the last year, the EPS has been growing by 36.31%, which is quite impressive.
- Measured over the past years, FTNT shows a very strong growth in Earnings Per Share. The EPS has been growing by 35.13% on average per year.
- The Revenue has grown by 10.40% in the past year. This is quite good.
- FTNT shows a strong growth in Revenue. Measured over the last years, the Revenue has been growing by 24.11% yearly.
- The Earnings Per Share is expected to grow by 16.69% on average over the next years. This is quite good.
- FTNT is expected to show quite a strong growth in Revenue. In the coming years, the Revenue will grow by 14.76% yearly.
Health Analysis for NASDAQ:FTNT
To gauge a stock's financial health, ChartMill utilizes a Health Rating on a scale of 0 to 10. This comprehensive evaluation encompasses liquidity and solvency, both in absolute terms and in comparison to industry peers. NASDAQ:FTNT has earned a 6 out of 10:
- FTNT has an Altman-Z score of 6.77. This indicates that FTNT is financially healthy and has little risk of bankruptcy at the moment.
- FTNT has a better Altman-Z score (6.77) than 70.25% of its industry peers.
- The Debt to FCF ratio of FTNT is 0.60, which is an excellent value as it means it would take FTNT, only 0.60 years of fcf income to pay off all of its debts.
- With a decent Debt to FCF ratio value of 0.60, FTNT is doing good in the industry, outperforming 77.42% of the companies in the same industry.
- Although FTNT does not score too well on debt/equity it has very limited outstanding debt, which is well covered by the FCF. We will not put too much weight on the debt/equity number as it may be because of low equity, which could be a consequence of a share buyback program for instance. This needs to be investigated.
Understanding NASDAQ:FTNT's Profitability
Discover ChartMill's exclusive Profitability Rating, a proprietary metric that assesses stocks on a scale of 0 to 10. It takes into consideration various profitability ratios and margins, both in absolute terms and relative to industry peers. Notably, NASDAQ:FTNT has achieved a 9:
- With an excellent Return On Assets value of 17.28%, FTNT belongs to the best of the industry, outperforming 94.27% of the companies in the same industry.
- FTNT has a Return On Equity of 168.47%. This is amongst the best in the industry. FTNT outperforms 99.64% of its industry peers.
- FTNT has a better Return On Invested Capital (25.60%) than 96.42% of its industry peers.
- The Average Return On Invested Capital over the past 3 years for FTNT is significantly above the industry average of 11.92%.
- The last Return On Invested Capital (25.60%) for FTNT is above the 3 year average (21.99%), which is a sign of increasing profitability.
- FTNT has a Profit Margin of 26.79%. This is amongst the best in the industry. FTNT outperforms 92.83% of its industry peers.
- FTNT's Profit Margin has improved in the last couple of years.
- Looking at the Operating Margin, with a value of 28.19%, FTNT belongs to the top of the industry, outperforming 94.27% of the companies in the same industry.
- FTNT's Operating Margin has improved in the last couple of years.
- FTNT has a Gross Margin of 79.71%. This is in the better half of the industry: FTNT outperforms 77.42% of its industry peers.
Why is NASDAQ:FTNT a setup?
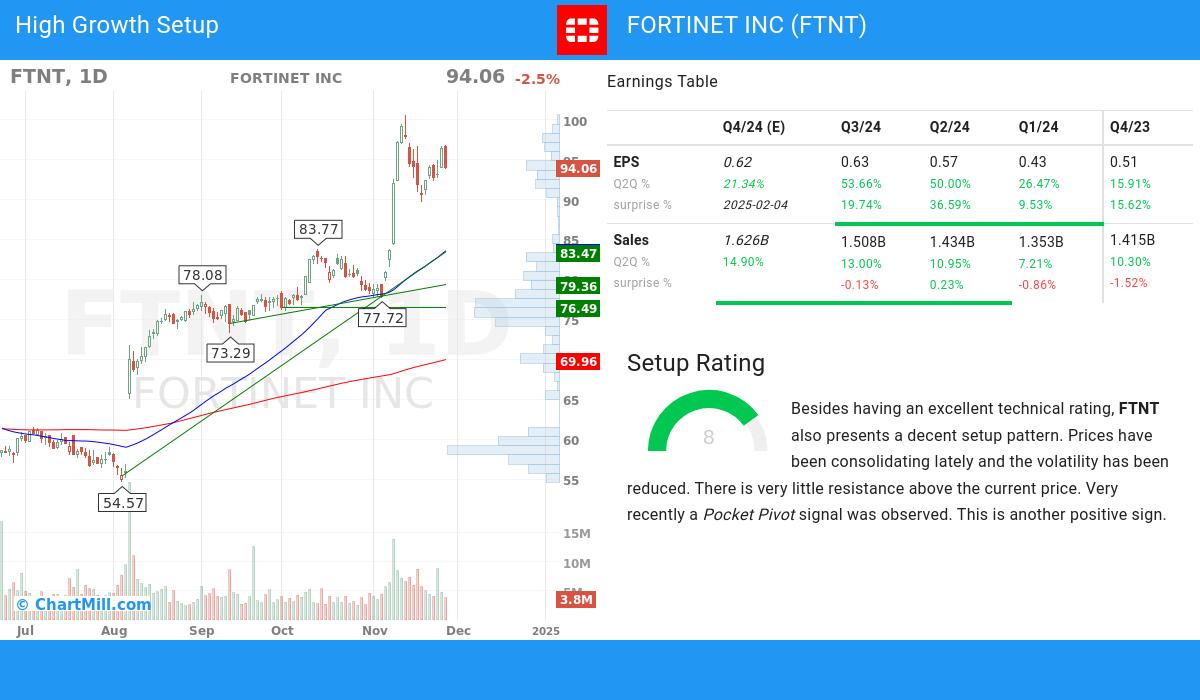
ChartMill incorporates a Setup Rating in its analysis, which measures the extent of consolidation in a stock over recent days and weeks. This rating, ranging from 0 to 10, is updated daily and takes into account multiple short-term technical indicators. The current setup rating for NASDAQ:FTNT is 8:
Besides having an excellent technical rating, FTNT also presents a decent setup pattern. Prices have been consolidating lately and the volatility has been reduced. There is very little resistance above the current price. Very recently a Pocket Pivot signal was observed. This is another positive sign.
Our Strong Growth screener lists more Strong Growth stocks and is updated daily.
Our latest full fundamental report of FTNT contains the most current fundamental analsysis.
For an up to date full technical analysis you can check the technical report of FTNT
Keep in mind
This article should in no way be interpreted as advice. The article is based on the observed metrics at the time of writing, but you should always make your own analysis and trade or invest at your own responsibility.