
For growth-minded investors, high revenue and EPS growth are key criteria. Today, we'll examine whether FORTINET INC (NASDAQ:FTNT) fits the bill for growth investing, particularly as it forms a base and hints at a potential breakout. Remember, due diligence is essential, but FORTINET INC has caught our attention on our screen for growth with base formation. It may warrant additional investigation.
Deciphering NASDAQ:FTNT's Growth Rating
ChartMill assigns a Growth Rating to every stock. This score ranges from 0 to 10 and evaluates the different growth aspects like EPS and Revenue, both in the past as in the future. NASDAQ:FTNT scores a 8 out of 10:
- The Earnings Per Share has grown by an impressive 28.86% over the past year.
- FTNT shows a strong growth in Earnings Per Share. Measured over the last years, the EPS has been growing by 35.13% yearly.
- FTNT shows quite a strong growth in Revenue. In the last year, the Revenue has grown by 11.02%.
- The Revenue has been growing by 24.11% on average over the past years. This is a very strong growth!
- FTNT is expected to show quite a strong growth in Earnings Per Share. In the coming years, the EPS will grow by 16.69% yearly.
- Based on estimates for the next years, FTNT will show a quite strong growth in Revenue. The Revenue will grow by 14.76% on average per year.
Evaluating Health: NASDAQ:FTNT
ChartMill utilizes a Health Rating to assess stocks, scoring them on a scale of 0 to 10. This rating takes into account a variety of liquidity and solvency ratios, both in absolute terms and in comparison to industry peers. NASDAQ:FTNT has earned a 6 out of 10:
- An Altman-Z score of 5.85 indicates that FTNT is not in any danger for bankruptcy at the moment.
- Looking at the Altman-Z score, with a value of 5.85, FTNT is in the better half of the industry, outperforming 71.28% of the companies in the same industry.
- The Debt to FCF ratio of FTNT is 0.63, which is an excellent value as it means it would take FTNT, only 0.63 years of fcf income to pay off all of its debts.
- Looking at the Debt to FCF ratio, with a value of 0.63, FTNT is in the better half of the industry, outperforming 77.31% of the companies in the same industry.
- Although FTNT does not score too well on debt/equity it has very limited outstanding debt, which is well covered by the FCF. We will not put too much weight on the debt/equity number as it may be because of low equity, which could be a consequence of a share buyback program for instance. This needs to be investigated.
Profitability Insights: NASDAQ:FTNT
Discover ChartMill's exclusive Profitability Rating, a proprietary metric that assesses stocks on a scale of 0 to 10. It takes into consideration various profitability ratios and margins, both in absolute terms and relative to industry peers. Notably, NASDAQ:FTNT has achieved a 9:
- FTNT has a Return On Assets of 16.30%. This is amongst the best in the industry. FTNT outperforms 93.62% of its industry peers.
- FTNT has a Return On Equity of 455.55%. This is amongst the best in the industry. FTNT outperforms 100.00% of its industry peers.
- FTNT has a Return On Invested Capital of 26.33%. This is amongst the best in the industry. FTNT outperforms 97.52% of its industry peers.
- FTNT had an Average Return On Invested Capital over the past 3 years of 21.99%. This is significantly above the industry average of 10.20%.
- The last Return On Invested Capital (26.33%) for FTNT is above the 3 year average (21.99%), which is a sign of increasing profitability.
- FTNT's Profit Margin of 23.71% is amongst the best of the industry. FTNT outperforms 91.13% of its industry peers.
- FTNT's Profit Margin has improved in the last couple of years.
- FTNT's Operating Margin of 26.05% is amongst the best of the industry. FTNT outperforms 94.33% of its industry peers.
- FTNT's Operating Margin has improved in the last couple of years.
- The Gross Margin of FTNT (78.09%) is better than 75.53% of its industry peers.
Looking at the Setup
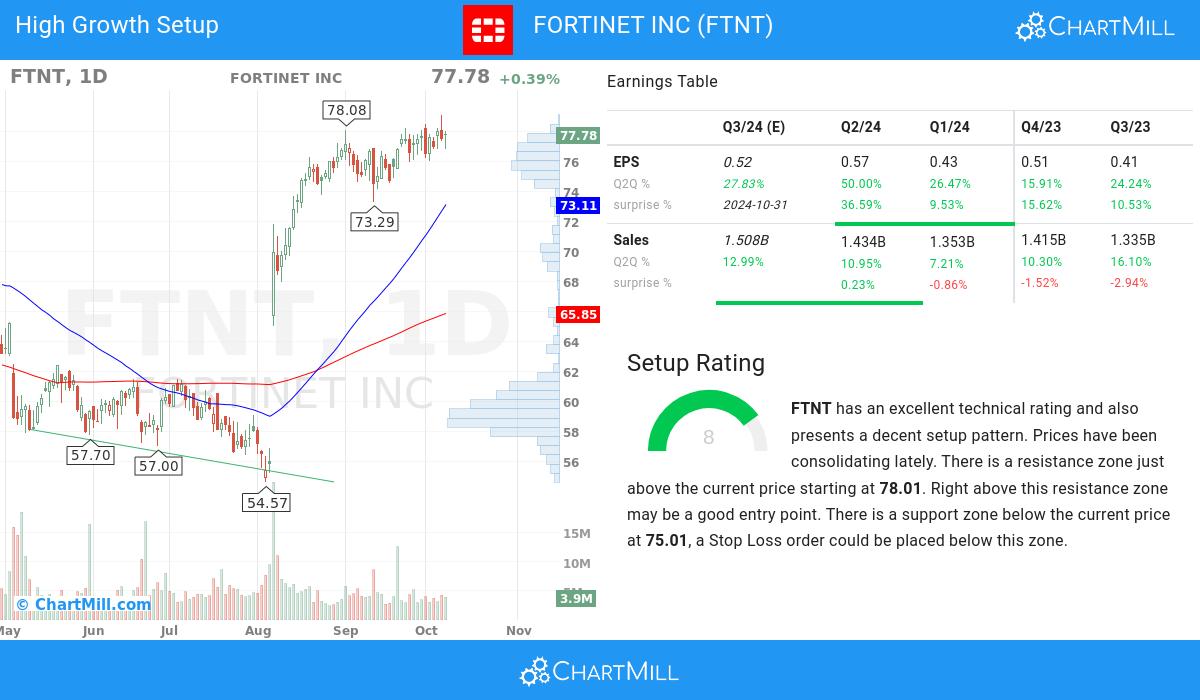
In addition to the Technical Rating, ChartMill provides a Setup Rating for each stock. This rating, ranging from 0 to 10, assesses the extent of consolidation in the stock based on multiple short-term technical indicators. Currently, NASDAQ:FTNT has a 8 as its setup rating:
FTNT has an excellent technical rating and also presents a decent setup pattern. Prices have been consolidating lately. There is a resistance zone just above the current price starting at 78.01. Right above this resistance zone may be a good entry point. There is a support zone below the current price at 75.01, a Stop Loss order could be placed below this zone.
Every day, new Strong Growth stocks can be found on ChartMill in our Strong Growth screener.
Check the latest full fundamental report of FTNT for a complete fundamental analysis.
Our latest full technical report of FTNT contains the most current technical analsysis.
Disclaimer
This article should in no way be interpreted as advice. The article is based on the observed metrics at the time of writing, but you should always make your own analysis and trade or invest at your own responsibility.