
Our stock screener has spotted FRONTDOOR INC (NASDAQ:FTDR) as an undervalued stock with solid fundamentals. FTDR shows decent health and profitability. At the same time it remains remains attractively priced. We'll dive into each aspect below.
What does the Valuation looks like for FTDR
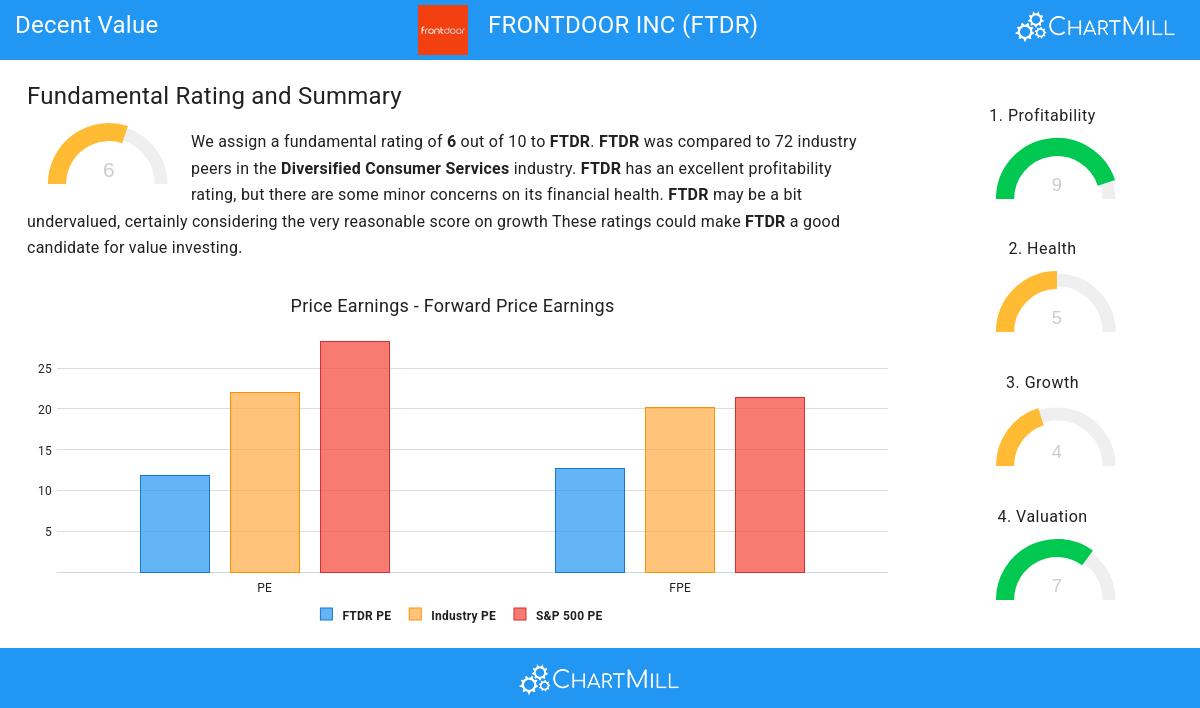
ChartMill assigns a Valuation Rating to each stock, ranging from 0 to 10. This rating is calculated by analyzing different valuation elements, such as price to earnings and free cash flow, both in absolute terms and relative to the market and industry. In the case of FTDR, the assigned 7 reflects its valuation:
- A Price/Earnings ratio of 11.89 indicates a reasonable valuation of FTDR.
- Based on the Price/Earnings ratio, FTDR is valued cheaper than 83.33% of the companies in the same industry.
- FTDR's Price/Earnings ratio indicates a rather cheap valuation when compared to the S&P500 average which is at 28.33.
- 81.94% of the companies in the same industry are more expensive than FTDR, based on the Price/Forward Earnings ratio.
- The average S&P500 Price/Forward Earnings ratio is at 21.37. FTDR is valued slightly cheaper when compared to this.
- Based on the Enterprise Value to EBITDA ratio, FTDR is valued a bit cheaper than 73.61% of the companies in the same industry.
- FTDR's Price/Free Cash Flow ratio is rather cheap when compared to the industry. FTDR is cheaper than 83.33% of the companies in the same industry.
- The excellent profitability rating of FTDR may justify a higher PE ratio.
Analyzing Profitability Metrics
ChartMill's Profitability Rating offers a unique perspective on stock analysis, providing scores from 0 to 10. These ratings consider a wide range of profitability metrics and margins, both in comparison to industry peers and on their own merits. For FTDR, the assigned 9 is a significant indicator of profitability:
- The Return On Assets of FTDR (11.15%) is better than 88.89% of its industry peers.
- FTDR's Return On Equity of 98.33% is amongst the best of the industry. FTDR outperforms 97.22% of its industry peers.
- FTDR has a Return On Invested Capital of 15.66%. This is amongst the best in the industry. FTDR outperforms 93.06% of its industry peers.
- FTDR had an Average Return On Invested Capital over the past 3 years of 20.06%. This is significantly above the industry average of 11.60%.
- The 3 year average ROIC (20.06%) for FTDR is well above the current ROIC(15.66%). The reason for the recent decline needs to be investigated.
- Looking at the Profit Margin, with a value of 12.76%, FTDR belongs to the top of the industry, outperforming 87.50% of the companies in the same industry.
- FTDR's Profit Margin has improved in the last couple of years.
- FTDR has a better Operating Margin (19.54%) than 84.72% of its industry peers.
- The Gross Margin of FTDR (53.69%) is better than 72.22% of its industry peers.
- FTDR's Gross Margin has improved in the last couple of years.
Looking at the Health
ChartMill assigns a Health Rating to every stock. This score ranges from 0 to 10 and evaluates the different health aspects like liquidity and solvency, both absolutely, but also relative to the industry peers. FTDR scores a 5 out of 10:
- FTDR's Altman-Z score of 2.81 is fine compared to the rest of the industry. FTDR outperforms 75.00% of its industry peers.
- With a decent Debt to FCF ratio value of 5.17, FTDR is doing good in the industry, outperforming 69.44% of the companies in the same industry.
Analyzing Growth Metrics
Every stock receives a Growth Rating from ChartMill, ranging from 0 to 10. This rating assesses various growth aspects, including historical and projected EPS and revenue growth. FTDR boasts a 4 out of 10:
- The Earnings Per Share has grown by an impressive 46.09% over the past year.
- Measured over the past years, FTDR shows a quite strong growth in Earnings Per Share. The EPS has been growing by 12.08% on average per year.
Every day, new Decent Value stocks can be found on ChartMill in our Decent Value screener.
Check the latest full fundamental report of FTDR for a complete fundamental analysis.
Disclaimer
Important Note: The content of this article is not intended as trading advice. It is essential to perform your own analysis and exercise caution when making trading decisions. The article presents observations created by automated analysis but does not guarantee any trading or investment outcomes. Always trade responsibly and make independent judgments.