
FRONTDOOR INC (NASDAQ:FTDR) is a hidden gem identified by our stock screening tool, featuring undervaluation and robust fundamentals. FTDR showcases decent financial health and profitability, coupled with an attractive price. Let's dig deeper into the analysis.
Evaluating Valuation: FTDR
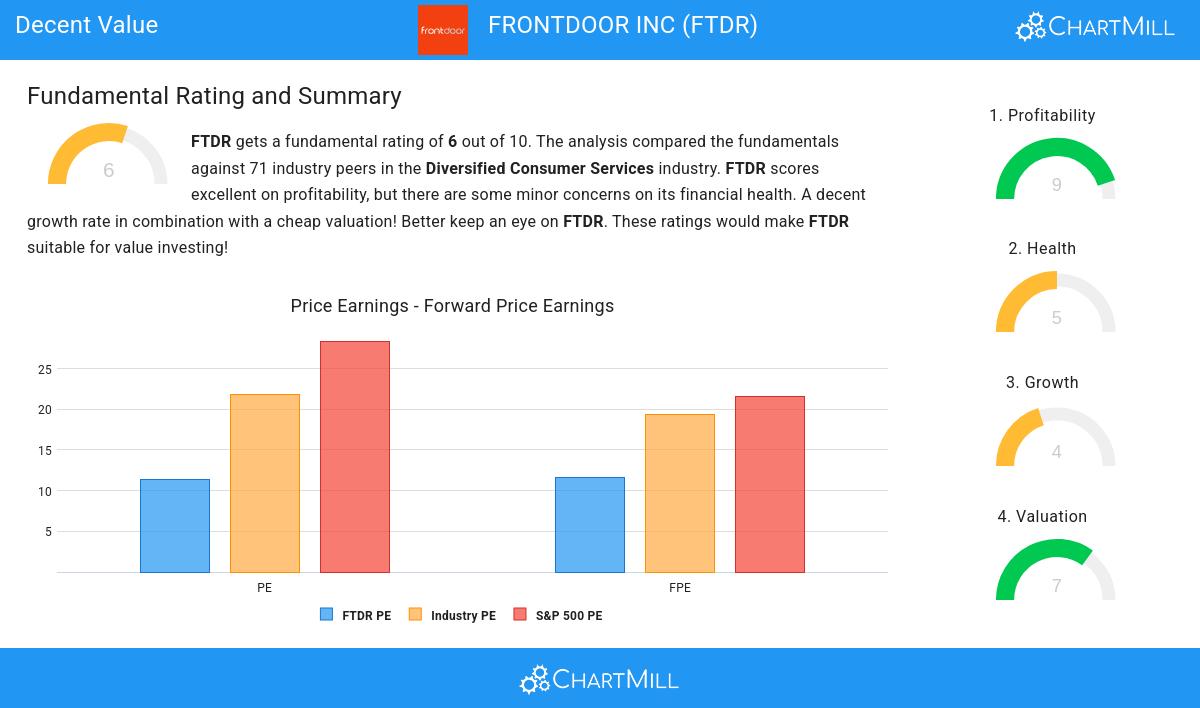
ChartMill assigns a Valuation Rating to each stock, ranging from 0 to 10. This rating is calculated by analyzing different valuation elements, such as price to earnings and free cash flow, both in absolute terms and relative to the market and industry. In the case of FTDR, the assigned 7 reflects its valuation:
- Based on the Price/Earnings ratio of 11.32, the valuation of FTDR can be described as reasonable.
- 83.10% of the companies in the same industry are more expensive than FTDR, based on the Price/Earnings ratio.
- The average S&P500 Price/Earnings ratio is at 28.37. FTDR is valued rather cheaply when compared to this.
- A Price/Forward Earnings ratio of 11.63 indicates a reasonable valuation of FTDR.
- Based on the Price/Forward Earnings ratio, FTDR is valued cheaper than 88.73% of the companies in the same industry.
- When comparing the Price/Forward Earnings ratio of FTDR to the average of the S&P500 Index (21.59), we can say FTDR is valued slightly cheaper.
- 80.28% of the companies in the same industry are more expensive than FTDR, based on the Enterprise Value to EBITDA ratio.
- 84.51% of the companies in the same industry are more expensive than FTDR, based on the Price/Free Cash Flow ratio.
- The excellent profitability rating of FTDR may justify a higher PE ratio.
Analyzing Profitability Metrics
Discover ChartMill's exclusive Profitability Rating, a proprietary metric that assesses stocks on a scale of 0 to 10. It takes into consideration various profitability ratios and margins, both in absolute terms and relative to industry peers. Notably, FTDR has achieved a 9:
- With an excellent Return On Assets value of 11.15%, FTDR belongs to the best of the industry, outperforming 88.73% of the companies in the same industry.
- Looking at the Return On Equity, with a value of 98.33%, FTDR belongs to the top of the industry, outperforming 97.18% of the companies in the same industry.
- The Return On Invested Capital of FTDR (15.66%) is better than 92.96% of its industry peers.
- The Average Return On Invested Capital over the past 3 years for FTDR is significantly above the industry average of 11.58%.
- The last Return On Invested Capital (15.66%) for FTDR is well below the 3 year average (20.06%), which needs to be investigated, but indicates that FTDR had better years and this may not be a problem.
- The Profit Margin of FTDR (12.76%) is better than 87.32% of its industry peers.
- In the last couple of years the Profit Margin of FTDR has grown nicely.
- The Operating Margin of FTDR (19.54%) is better than 84.51% of its industry peers.
- With a decent Gross Margin value of 53.69%, FTDR is doing good in the industry, outperforming 71.83% of the companies in the same industry.
- FTDR's Gross Margin has improved in the last couple of years.
Analyzing Health Metrics
ChartMill assigns a proprietary Health Rating to each stock. The score is computed by evaluating various liquidity and solvency ratios and ranges from 0 to 10. FTDR was assigned a score of 5 for health:
- FTDR's Altman-Z score of 2.77 is fine compared to the rest of the industry. FTDR outperforms 71.83% of its industry peers.
- FTDR has a better Debt to FCF ratio (5.17) than 67.61% of its industry peers.
Growth Examination for FTDR
To evaluate a stock's growth potential, ChartMill utilizes a Growth Rating on a scale of 0 to 10. This comprehensive assessment considers various growth aspects, including historical and estimated EPS and revenue growth. FTDR has achieved a 4 out of 10:
- FTDR shows a strong growth in Earnings Per Share. In the last year, the EPS has been growing by 46.09%, which is quite impressive.
- Measured over the past years, FTDR shows a quite strong growth in Earnings Per Share. The EPS has been growing by 12.08% on average per year.
Our Decent Value screener lists more Decent Value stocks and is updated daily.
Our latest full fundamental report of FTDR contains the most current fundamental analsysis.
Keep in mind
Important Note: The content of this article is not intended as trading advice. It is essential to perform your own analysis and exercise caution when making trading decisions. The article presents observations created by automated analysis but does not guarantee any trading or investment outcomes. Always trade responsibly and make independent judgments.