
Investors aiming to join strict technical discipline with an emphasis on fundamental growth frequently consider methods like the one made popular by Mark Minervini. His plan, called Specific Entry Point Analysis (SEPA), methodically finds stocks showing both firm price trends and quickening business results. The objective is to take leaders early in their main price increases by sorting for companies that are not only technically healthy, trading in clear uptrends close to new highs, but also showing better earnings and sales momentum. This two-part method tries to reduce risk by making sure a stock's chart firmness is supported by real, getting-better fundamentals.
Fabrinet (NYSE:FN) provides optical packaging and electronic manufacturing services and recently appeared through a scan made to locate such high-growth momentum stocks that also meet Minervini's strict Trend Template. This pairing indicates the stock may deserve more study from growth-focused investors.
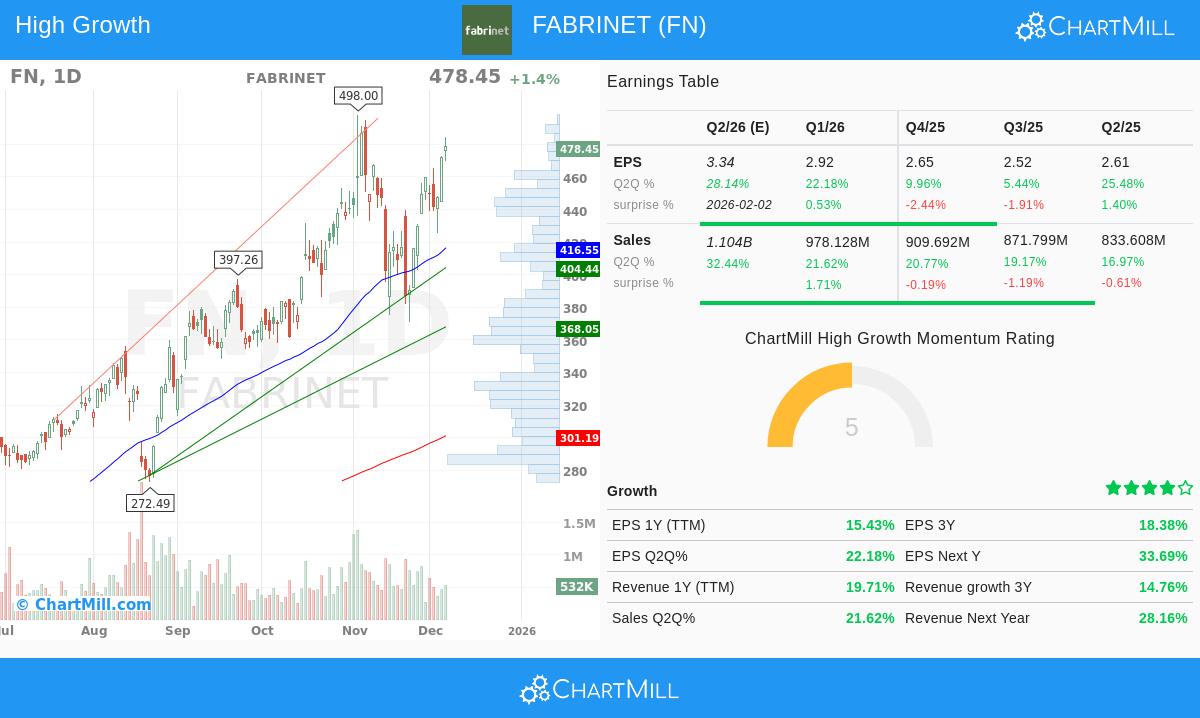
Technical Fit with the Minervini Trend Template
A central idea of the Minervini plan is to put money in the direction of a verified trend, staying away from the danger of trying to "catch a falling knife." The Trend Template gives a clear, rules-based list to find stocks in a confirmed Stage 2 uptrend. Using the given data, Fabrinet seems to fit these important technical conditions:
- Price Above Key Moving Averages: The present price of $478.45 trades far above the rising 50-day ($416.55), 150-day ($334.84), and 200-day ($301.19) simple moving averages (SMAs). This order confirms the stock is in a continued uptrend across several timeframes.
- Moving Average Order: The 50-day SMA is above both the 150-day and 200-day SMAs, and the 150-day SMA is above the 200-day SMA. This step-by-step positive order shows quickening momentum and is a sign of firm trending action.
- Nearness to Highs: At $478.45, FN is trading within 4% of its 52-week high of $498.00. Minervini points out that real market leaders often make their largest moves from a place of firmness, not from big pullbacks. At the same time, the stock is more than 220% above its 52-week low, showing a strong recovery and uptrend.
- Better Relative Strength: With a ChartMill Relative Strength (CRS) score of 94.67, FN is doing better than nearly 95% of all stocks. High relative strength is a required filter in the SEPA process, as it finds sector and market leaders that usually draw institutional money.
This technical view shows FN as a stock in a firm, clear uptrend, meeting the basic "trend" part of Minervini's SEPA method.
Fundamental Support for High Growth Momentum
While a firm chart is necessary, the Minervini plan requires it must be supported by solid and quickening fundamentals. This is where the "High Growth Momentum" part of the scan becomes important. The given data points show Fabrinet is displaying the kind of operational performance that can maintain a major price increase.
- Earnings Growth Quickening: The company is showing a sequence of quickening quarterly earnings growth. The newest quarter had year-over-year EPS growth of 22.2%, a notable rise from the 9.96% and 5.44% growth rates in the two earlier quarters. This re-quickening is an important sign that business momentum is growing.
- Firm Sales Increase: Revenue growth stays solid, with the last quarter up 21.6% year-over-year. Also, analyst positive view is growing; the average guess for next year's revenue has been changed upward by over 11% in the last three months. Rising guesses often come before more institutional buying.
- Steady Profitability: The company keeps good and stable profit margins, with the last reported quarter at 9.81%. Steady profitability during a high-growth phase shows scalable operations and careful management.
- Positive Analyst Changes: The average guess for next year's earnings has been changed upward by 9.58% over the past three months. As Minervini states, upward earnings changes are a strong catalyst, showing growing belief in the company's future and often pulling in new investors.
These fundamental numbers address the "fundamentals" and "catalyst" parts of the SEPA plan. They indicate FN's price firmness is not speculative but is backed by improving business results and good moves in analyst feeling.
Technical Condition and Setup Points
A look at Fabrinet's technical report summary gives the stock a top-level rating of 10 out of 10, showing outstanding technical condition. The long-term and short-term trends are both positive, and the stock is a top performer in its industry. However, the report states the present setup rating is a 4, showing that after a notable rise, the stock's price movement has been changeable and it is not now in a tight consolidation shape best for a new low-risk entry.
This is a vital difference in the Minervini structure: a stock can be technically very good but not offer a best entry point. The plan stresses waiting, watching for the stock to form a proper volatility contraction pattern (VCP) or base before thinking about a position. This allows for a clear setting of risk with a close stop-loss level.
For a full breakdown of the technical study, including support levels and trend evaluations, you can see the full ChartMill Technical Report for FN.
Conclusion
Fabrinet offers a strong example of a stock that fits with the ideas of growth momentum investing as described by plans like Minervini's SEPA. It meets the strict technical filters of the Trend Template, confirming a firm Stage 2 uptrend led by outstanding relative strength. Fundamentally, it shows quickening earnings growth, firm sales increase, and positive analyst changes, the very catalysts that can push a stock forward.
The main point for investors is that while FN fits the conditions for being on a watchlist of high-potential leaders, the present stretched price action indicates care about quick entry. The disciplined method would be to watch the stock for a constructive time of consolidation, which would give a higher-probability, lower-risk setup fitting the full method.
Interested in locating other stocks that meet similar high-growth and technical conditions? You can examine the preset scan used for this study via this High Growth Momentum + Trend Template Screener.
Disclaimer: This article is for information and learning only. It is not a suggestion to buy or sell any security. The study is based on given data and a specific investment method. All investing includes risk, including the possible loss of principal. You should do your own study and talk with a qualified financial advisor before making any investment choices.