
For investors looking to join solid fundamental growth with good technical positioning, a multi-layered screening method can be very useful. One such process involves selecting stocks that show firm earnings momentum, a sign of high-growth investing, while also having good technical condition and a helpful chart formation ready for a possible breakout. This method tries to find companies where speeding business fundamentals are meeting positive price action, indicating the chance of further upward movement. Fabrinet (NYSE:FN) comes from such a screen, offering a case for examination by growth-focused investors.
Fundamental Growth Momentum
Fabrinet's attraction for momentum investors starts with its basic business results. The company's High Growth Momentum (HGM) Rating of 6 shows a firm, above-average result across important growth and momentum measures. This rating brings together different parts key to growth investing, like recent earnings speed increase, sales growth, and analyst opinion.
A detailed view of the given data shows the forces behind this rating:
- Firm Quarterly Speed Increase: The latest quarter displayed a large year-over-year EPS growth of 28.7%, a clear speed increase from the 22.2% growth in the quarter before and 9.96% growth two quarters ago. This sequence of rising growth rates is a good sign for momentum plans.
- Solid Sales Growth: Revenue growth is equally strong, with the last quarter rising 35.9% year-over-year. This also shows a speed increase from the earlier quarters, pointing to firm demand for Fabrinet's optical packaging and manufacturing services.
- Good Analyst Changes: Forward estimates are moving up, a key part of the HGM rating. Analyst changes for next year's EPS and revenue have grown by 9.03% and 10.75% over the past three months, in that order, showing rising belief in the company's short-term future.
- Sound Profitability: The company keeps steady and growing profit margins. The last reported quarterly profit margin of 9.94% shows step-by-step betterment and is above the levels from the same quarter a year earlier.
While free cash flow growth has been negative over the past year and the company has a varied history of earnings surprises, the main trends in sales, earnings speed increase, and upward estimate changes add to a fundamentally positive growth picture. For a momentum plan, this mix of speeding operational results and improving analyst view is exactly what screens try to find.
Technical Condition and Formation Quality
A strong fundamental story is most effective when supported by the price chart. Fabrinet's technical picture, as described in its technical analysis report, gives this support. The stock gets a solid Technical Rating of 8, showing very good technical condition.
Important technical good points include:
- Strong Long-Term Trend: The long-term trend is firmly positive, with the stock price trading well above its key rising moving averages (50-day, 100-day, and 200-day).
- Market Outperformance: Fabrinet has been a notable performer, doing better than 95% of all stocks over the past year and placing in the top group of its industry.
- Pause within Uptrend: Lately, the stock has started a time of pause, absorbing its large gains. This has created what chart readers call a "base," which is needed for preparing a new possible rise.
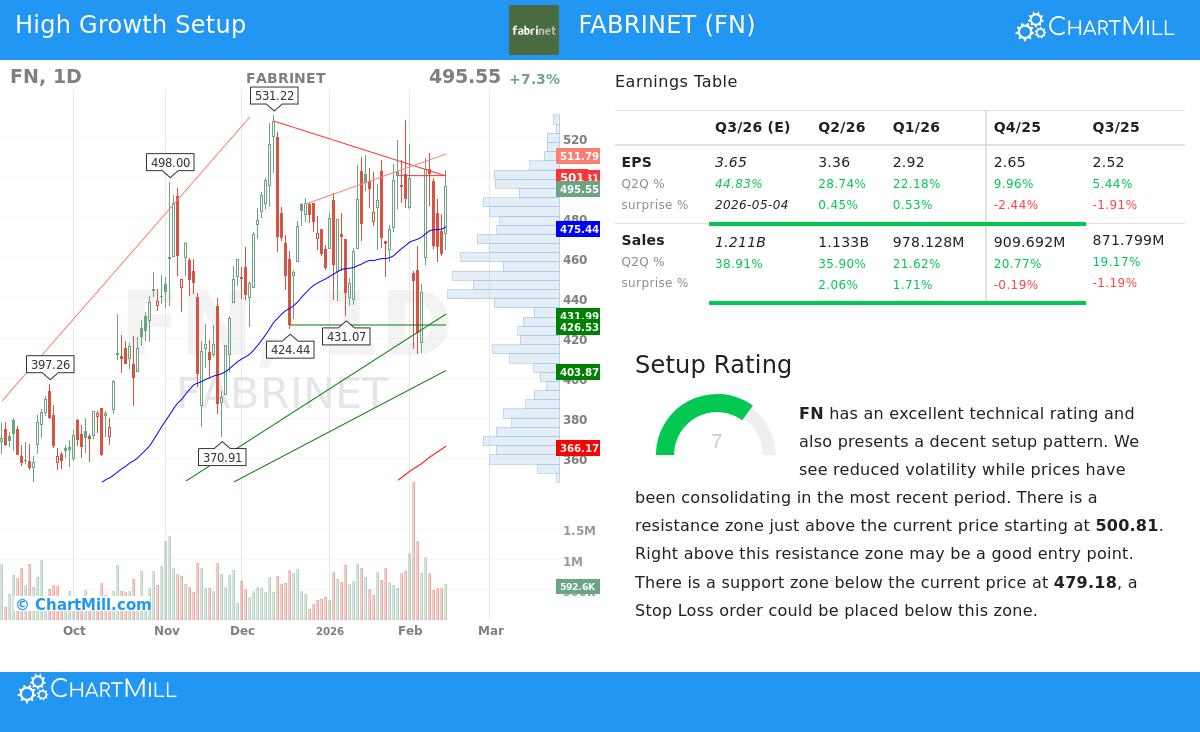
This is where the Setup Rating of 7 becomes especially related. The rating measures the quality of the present chart formation, suggesting Fabrinet is making a helpful setup. The analysis states "reduced volatility while prices have been pausing in the latest period." The report finds a clear resistance area just above the present price (around $500.81,$504.00) and a support area below (near $479.18). For breakout traders, a move above the resistance level could signal the restart of the main uptrend, giving a clear entry point with a reasonable stop-loss level below support.
Combination for the Momentum Investor
Fabrinet offers a strong meeting of standards important for high-growth momentum investing. The fundamental screen found speeding earnings and sales growth joined with positive estimate changes, factors that often come before more price gain. The technical screen then supports that this fundamental condition is seen in the price action, with the stock in a long-term uptrend and now waiting in a pause formation that gives a measurable risk/reward setup.
The plan of joining high growth momentum with technical breakout formations tries to time entries into leading stocks as their business momentum lines up with a new stage of price momentum. Fabrinet, with an HGM Rating of 6, a Technical Rating of 8, and a Setup Rating of 7, seems to fit these joined standards.
Finding Like Chances
Investors curious about using this joined growth-and-technical plan to find other possible choices can look at the preset screen. More results from this High Growth Momentum Breakout Setups screen can be found here.
Disclaimer: This article is for information only and does not form investment advice, a suggestion, or an offer to buy or sell any security. The study is based on given data and shows conditions at a specific time. Investors should do their own complete research and think about their personal money situation and risk comfort before making any investment choices. Past results are not a guide for future results.