
FABRINET (NYSE:FN) was identified as an affordable growth stock by our stock screener. FN is showing great growth, but also scores well on profitability, solvency and liquidity. At the same time it seems to be priced reasonably. We'll explore this a bit deeper below.
Evaluating Growth: FN
Every stock receives a Growth Rating from ChartMill, ranging from 0 to 10. This rating assesses various growth aspects, including historical and projected EPS and revenue growth. FN boasts a 6 out of 10:
- FN shows a strong growth in Earnings Per Share. In the last year, the EPS has been growing by 19.21%, which is quite good.
- The Earnings Per Share has been growing by 18.44% on average over the past years. This is quite good.
- FN shows quite a strong growth in Revenue. In the last year, the Revenue has grown by 8.99%.
- The Revenue has been growing by 12.72% on average over the past years. This is quite good.
- The Earnings Per Share is expected to grow by 16.20% on average over the next years. This is quite good.
- Based on estimates for the next years, FN will show a quite strong growth in Revenue. The Revenue will grow by 15.02% on average per year.
A Closer Look at Valuation for FN
ChartMill assigns a Valuation Rating to each stock, ranging from 0 to 10. This rating is calculated by analyzing different valuation elements, such as price to earnings and free cash flow, both in absolute terms and relative to the market and industry. In the case of FN, the assigned 5 reflects its valuation:
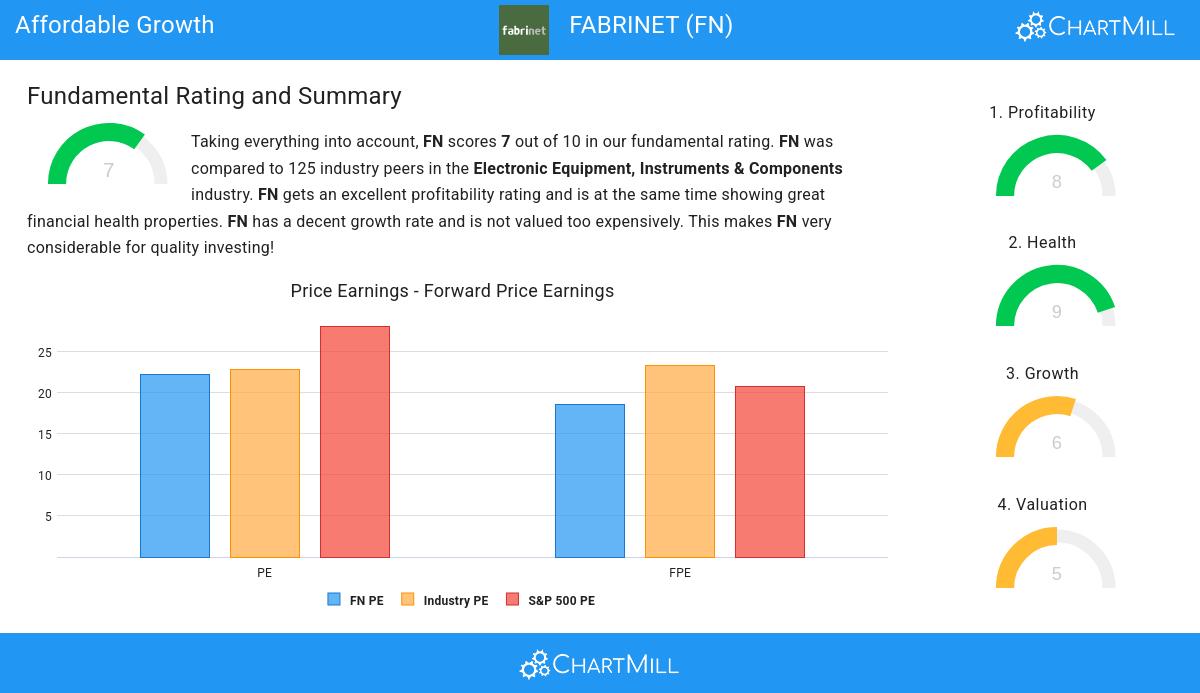
- Based on the Price/Earnings ratio, FN is valued a bit cheaper than the industry average as 66.40% of the companies are valued more expensively.
- When comparing the Price/Earnings ratio of FN to the average of the S&P500 Index (28.10), we can say FN is valued slightly cheaper.
- 66.40% of the companies in the same industry are more expensive than FN, based on the Price/Forward Earnings ratio.
- Based on the Price/Free Cash Flow ratio, FN is valued a bit cheaper than 68.80% of the companies in the same industry.
- FN has an outstanding profitability rating, which may justify a higher PE ratio.
- A more expensive valuation may be justified as FN's earnings are expected to grow with 16.20% in the coming years.
How do we evaluate the Health for FN?
ChartMill utilizes a Health Rating to assess stocks, scoring them on a scale of 0 to 10. This rating takes into account a variety of liquidity and solvency ratios, both in absolute terms and in comparison to industry peers. FN has earned a 9 out of 10:
- FN has an Altman-Z score of 10.19. This indicates that FN is financially healthy and has little risk of bankruptcy at the moment.
- Looking at the Altman-Z score, with a value of 10.19, FN belongs to the top of the industry, outperforming 90.40% of the companies in the same industry.
- There is no outstanding debt for FN. This means it has a Debt/Equity and Debt/FCF ratio of 0 and it is amongst the best of the sector and industry.
- A Current Ratio of 3.32 indicates that FN has no problem at all paying its short term obligations.
- FN's Current ratio of 3.32 is fine compared to the rest of the industry. FN outperforms 72.00% of its industry peers.
- A Quick Ratio of 2.58 indicates that FN has no problem at all paying its short term obligations.
- FN's Quick ratio of 2.58 is fine compared to the rest of the industry. FN outperforms 70.40% of its industry peers.
Exploring FN's Profitability
ChartMill employs its own Profitability Rating system for stock evaluation. This score, ranging from 0 to 10, is derived from an analysis of diverse profitability metrics and margins. In the case of FN, the assigned 8 is noteworthy for profitability:
- FN has a Return On Assets of 12.82%. This is amongst the best in the industry. FN outperforms 92.80% of its industry peers.
- FN's Return On Equity of 17.69% is amongst the best of the industry. FN outperforms 88.00% of its industry peers.
- Looking at the Return On Invested Capital, with a value of 12.67%, FN belongs to the top of the industry, outperforming 88.80% of the companies in the same industry.
- FN had an Average Return On Invested Capital over the past 3 years of 12.81%. This is above the industry average of 9.30%.
- FN has a Profit Margin of 10.44%. This is amongst the best in the industry. FN outperforms 84.80% of its industry peers.
- FN's Profit Margin has improved in the last couple of years.
- FN has a Operating Margin of 9.65%. This is in the better half of the industry: FN outperforms 80.00% of its industry peers.
- FN's Operating Margin has improved in the last couple of years.
- FN's Gross Margin has improved in the last couple of years.
More Affordable Growth stocks can be found in our Affordable Growth screener.
Our latest full fundamental report of FN contains the most current fundamental analsysis.
Disclaimer
Important Note: The content of this article is not intended as trading advice. It is essential to perform your own analysis and exercise caution when making trading decisions. The article presents observations created by automated analysis but does not guarantee any trading or investment outcomes. Always trade responsibly and make independent judgments.