
For investors using a technical breakout method, the goal is to find stocks that are in a firm, clear uptrend and are also resting in a consolidation. This rest, or "setup," forms a possible entry point just before the stock tries to move to new highs, giving a good balance of risk and potential gain. The method depends on two proprietary scores: the ChartMill Technical Rating, which measures the general condition and trend force of a stock, and the ChartMill Setup Quality Rating, which judges the condition of its present consolidation pattern. A stock with high marks on both measures is a strong candidate for this method.
FIRST BANCORP PUERTO RICO (NYSE:FBP) recently appeared on such a breakout screen, suggesting it may be preparing for its next upward move. The bank holding company, which offers various personal, commercial, and corporate banking services mainly in Puerto Rico and the U.S. Virgin Islands, is displaying a positive technical view that fits the method's main ideas.
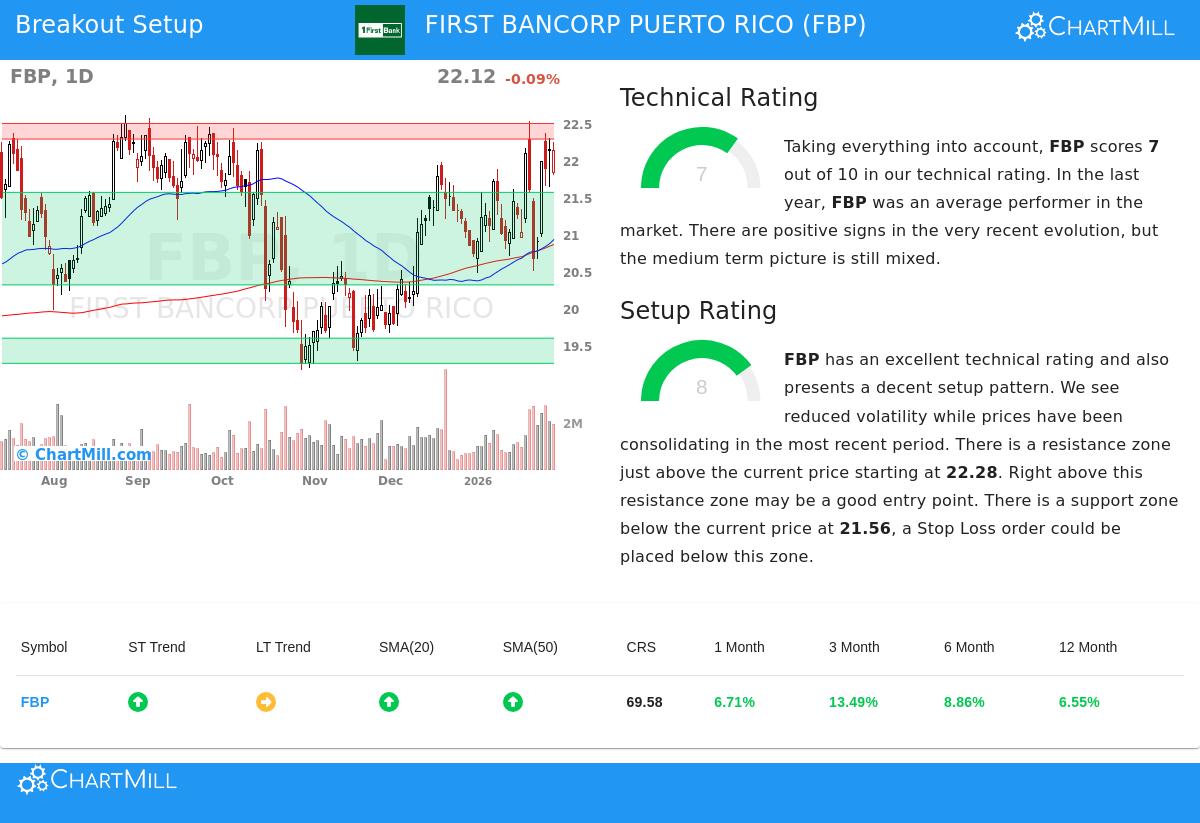
Technical Strength: A Firm Base
The base of any breakout trade is a stock with solid technical strength, confirming the momentum is positive. FBP's ChartMill Technical Rating of 7 out of 10 shows it is in a clear uptrend. A closer review of the technical report shows the parts of this strength:
- Trend Direction: While the long-term trend is still seen as neutral, the short-term trend is positive. This indicates the stock is gaining speed and drawing new attention from traders, a needed step before a continued breakout.
- Price Level: FBP is trading close to its 52-week high of $22.61. Trading near highs is important for breakout methods, as it shows the stock is moving past earlier selling pressure and could move into new, open territory.
- Moving Average Backing: The stock is trading above all its main simple moving averages (20, 50, 100, and 200-day), and each of these averages is rising. This layered arrangement of rising support levels is a typical sign of a sound uptrend, offering several points of possible support on any decline.
This mix of factors, a positive short-term trend, closeness to new highs, and firm moving average backing, confirms the stock's technical rating and addresses the strategic question of which stock has the momentum to maintain a breakout move.
Setup Quality: The Consolidation Before the Move
A strong trend by itself is insufficient; buying at the correct moment is critical. This is where the Setup Quality Rating of 8 becomes important. A high score shows the stock is in a positive consolidation, narrowing its trading band and gathering force for a possible breakout. FBP's present chart activity shows several key setup traits:
- Clear Trading Band: Over the last month, FBP has been consolidating inside a band between about $20.47 and $22.53. Trading inside a set band after a rise lets the stock absorb its gains and sets clear levels for support and resistance.
- Lower Volatility & Increasing Volume: The analysis mentions "lower volatility while prices have been consolidating," which is common for a good setup. Also, volume has been higher in recent days during upward moves, pointing to accumulation and institutional activity, a positive signal that often comes before a breakout.
- Clear Support and Resistance: The technical report finds a clear support area between $20.31 and $21.56, made by a combination of moving averages and trendlines. Just above the present price, a resistance area is between $22.28 and $22.49. This well-defined structure allows for exact trade planning, a key part of the breakout method.
The existence of a tight consolidation near highs, with clear limits and positive volume, directly answers the strategic question of when to think about an entry. It gives a logical place to set a buy order above resistance (expecting the breakout) and a stop-loss order below support (controlling risk if the breakout does not occur).
A Possible Trade Plan
From this analysis, the automated report proposes a specific trading idea. It suggests an entry at $22.50, a buy-stop order set just above the noted resistance area to confirm the breakout is starting. The suggested exit, or stop-loss, is at $20.48, set below the recent consolidation support. This establishes a risk of about 9% on the trade. Investors should note this is an active, automatically created example; many may prefer to use a wider stop based on the stronger support areas found lower on the chart, changing the position size to control total portfolio risk.
Finding Other Breakout Possibilities
The technical breakout method is an active process, and new setups appear daily as market situations change. FBP is one instance found by a systematic screen. Investors searching for an updated list of stocks showing firm technical ratings and good setup patterns can check the newest results directly in the Technical Breakout Setups screen.
Disclaimer: This article is for information only and is not investment advice, a suggestion, or an offer or solicitation to buy or sell any securities. The analysis uses technical measures and past data, which do not assure future results. All trading and investment choices involve risk, including the possible loss of principal. Investors should perform their own research and investigation and think about speaking with a qualified financial professional before making any investment choices.