
For technical investors looking to find stocks ready for their next rise, a common method centers on two main parts: the basic trend strength and the nature of the present price formation. The aim is to locate stocks that are already in solid, confirmed upward trends but are now pausing, gathering their advances in a narrow band. This gathering forms a possible "launching" effect, giving a more distinct entry point with clear risk if the stock moves past prior high points. A search for these "Technical Breakout Formations" selects for stocks with good scores in both trend condition and formation grade, trying to find chances where a trend extension is more likely from a statistical view.
Expeditors International of Washington Inc (NYSE:EXPD) recently appeared from such a search, presenting an interesting chart for traders concentrated on momentum and formation identification. The global logistics company seems to be gathering force for a possible price change, joining solid long-term condition with a short-term gathering formation.
Examining the Basic Trend Strength
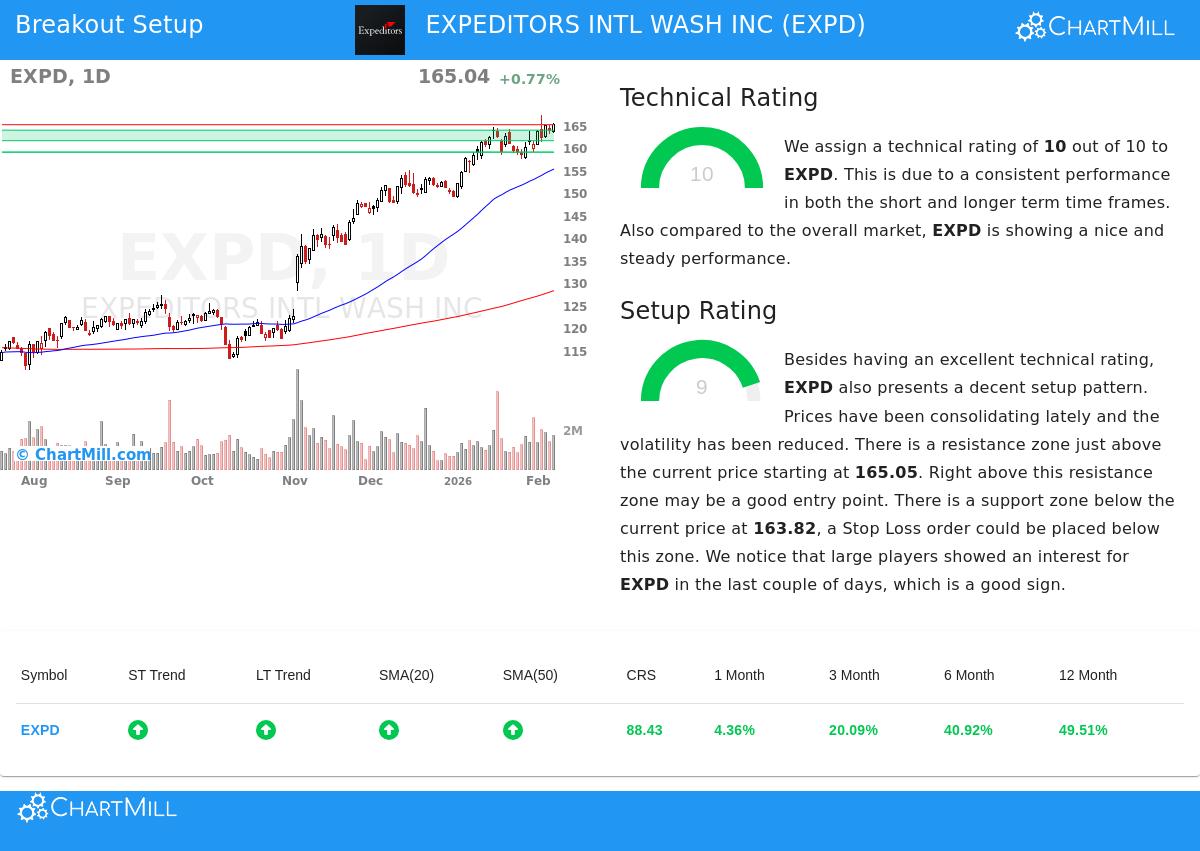
The base of any breakout trade is the existing trend. A stock trying to break out from a poor or falling trend meets notable obstacles. For EXPD, the trend condition is very solid, as outlined in its ChartMill Technical Analysis report. The stock receives a complete Technical Rating of 10, which measures its very good technical condition across several time periods.
This high rating is backed by a number of specific factors:
- Steady Upward Trends: Both the long-term and short-term trends for EXPD are scored as good. The stock is priced above all its important moving averages (20, 50, 100, and 200-day SMAs), and each of these averages is itself in an upward arrangement.
- Better Relative Performance: EXPD has done much better than the wider market and similar companies. Over the last year, the stock has performed better than 88% of all other stocks and does better than 86% of stocks in the competitive Air Freight & Logistics field.
- Closeness to High Points: The stock is now priced near its 52-week high of $167.19. This is a positive sign, showing continued buyer interest and an absence of supply from investors holding at higher price levels.
This solid technical foundation is important because it raises the chance that any breakout from a gathering will work and lead to an extension of the confirmed upward trend, instead of a failed signal.
Reviewing the Formation and Gathering Pattern
While a solid trend is needed, it is not enough for a good trade entry. A stock that has risen sharply may be "stretched," meaning it is ready for a decline and gives a poor risk/reward entry. This is where the Formation Grade score becomes key, as it finds times of pause or gathering inside the larger trend.
EXPD shows a high-grade formation, scoring a 9 on this measure. The study points to lower volatility while prices have been gathering in a set band over the recent period. In detail, the stock has been trading between about $157 and $167 over the last month, and it is now positioned near the top of this band.
This gathering has helped the price action stabilize near important moving averages, letting the trend "move closer" and form a base of support. The technical report notes a clear resistance area just above the present price, starting at $165.05. The existence of a set resistance level is good for breakout traders, as it gives a specific line: a continued move above this level could mark the end of the gathering and the start of the next upward stage.
Trade Plan and Risk Control
For traders acting on this formation, the plan is simple. The proposed entry point is a buy stop order just above the noted resistance at $165.06. This makes sure of involvement only if the stock gains enough momentum to pass through the gathering top.
Careful risk control is set by a stop-loss order placed just below the nearest support area around $161.47. This sets the maximum risk on the trade to about 2.2% from entry to stop. The report also mentions more activity from large traders (as seen by the Effective Volume measure) in recent days, which can sometimes come before important price changes.
It is important to recall that while the pattern is clear, no formation assures a win. The nearness of the stop to the entry leads to a fairly narrow risk setting, which traders should weigh against their own plan and the stock's Average True Range of about 1.84%.
Locating Comparable Chances
The process that found EXPD can be used in a regular way to discover new possible breakout choices each day. By concentrating on stocks that at the same time show solid technical ratings and high-grade formation patterns, traders can effectively sort through the market for similar chances.
For a present list of stocks fitting these Technical Breakout Formation rules, you can see the newest search findings here: Technical Breakout Formations Screen.
,
Disclaimer: This article is for information and learning only. It is not meant as investment guidance, a suggestion to buy or sell any security, or a plan for financial decisions. All trading and investment choices include risk, including the possible loss of the original amount invested. The study provided is based on technical measures and past data, which are not promises of future results. Always do your own complete research and think about talking with a certified financial advisor before making any investment choices.