
For investors who use charts and price action to guide choices, a methodical way to find possible trades is important. One method looks for stocks that show good technical condition and are making a constructive price pattern, a pairing that can point to a possible breakout. This tactic centers on two specific metrics from ChartMill: the Technical Rating, which judges the general condition and trend of a stock, and the Setup Quality Rating, which judges the condition of its present consolidation pattern. The aim is to find leading stocks that are resting before their next possible advance, giving a more distinct entry point with clear risk.
Our recent search using this method has pointed to Edwards Lifesciences Corp (NYSE:EW) as a candidate that deserves more attention from a technical viewpoint.
Judging Technical Condition
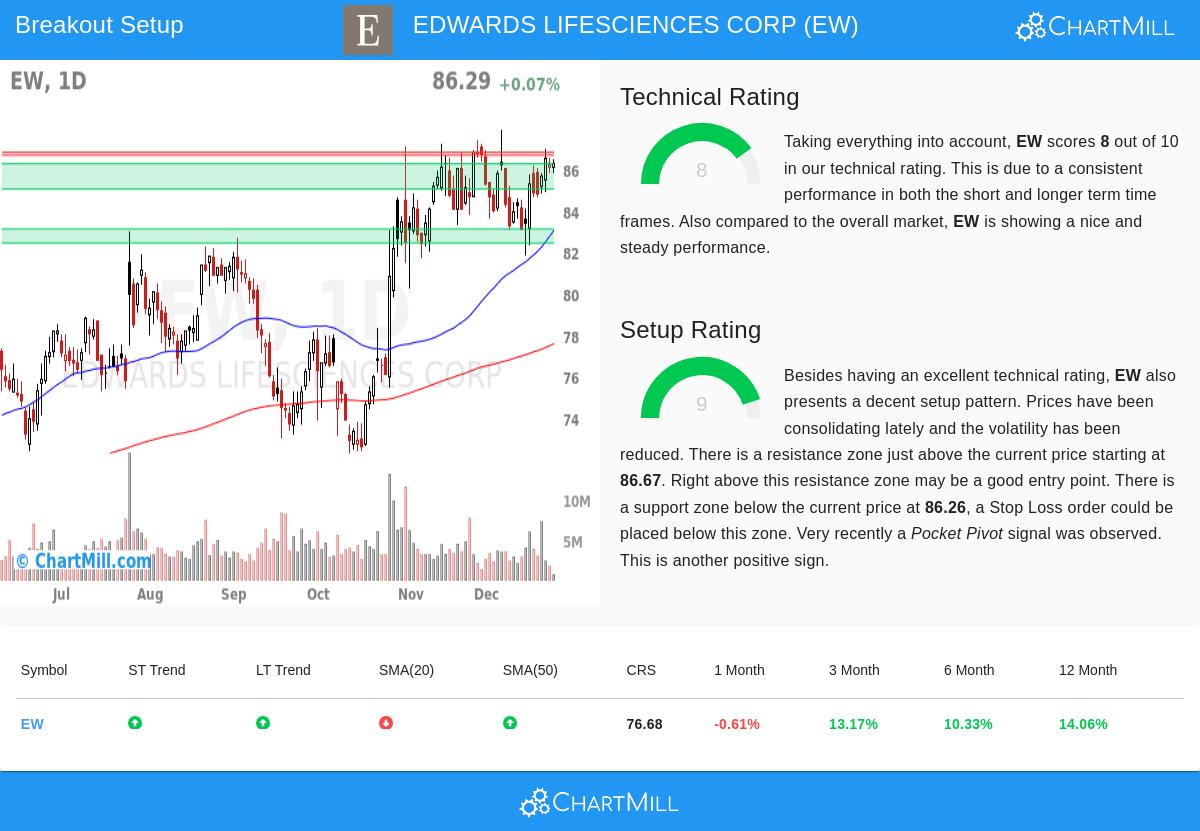
The base of a breakout tactic is a stock's core trend. A good Technical Rating shows a stock is in a sound uptrend and doing better than similar stocks, which is important because breakouts inside established uptrends have a greater chance of working. Edwards Lifesciences shows this basic condition with a solid Technical Rating of 8 out of 10.
A look at the full technical report shows several main parts adding to this score:
- Trend Agreement: Both the long-term and short-term trends for EW are scored as positive. This agreement across timeframes points to continued buying pressure and lowers the chance of an opposing downtrend.
- Good Relative Performance: The stock is performing better than 76% of all stocks in the market over the last year and is in the top quarter within its Health Care Equipment & Supplies industry. This relative condition is a sign of market leadership.
- Supportive Moving Averages: The stock's price is trading above its important moving averages (20, 50, 100, and 200-day), which act as changing support levels. The fact that the 50, 100, and 200-day averages are all increasing confirms the positive core structure.
- Nearness to Highs: EW is now trading close to its 52-week high of $87.89. While this could mean the stock is stretched, the setting of a good overall market (with the S&P 500 also near highs) and a constructive setup pattern (talked about next) can present this as a sign of condition.
Judging the Setup Quality
A high Technical Rating by itself is not a buy signal; a stock can be overbought. This is where the Setup Quality Rating becomes key. It finds times of consolidation or "tight" trading, which often come before the next advance. A high score suggests a clear support level and a possible entry point with a sensible place for a protective stop-loss order. Edwards Lifesciences does well here too, having a Setup Rating of 9.
The technical report explains why the present pattern is seen as high-quality:
- Price Consolidation: The report states that prices have been consolidating lately inside a one-month range of $81.85 to $87.89. This time of lower volatility after a rise lets the stock absorb its gains and form a base for the next move.
- Clear Support and Resistance: The analysis finds a definite support zone between $85.04 and $86.26, made by a mix of trendlines and moving averages. Just above the present price lies a set resistance area between $86.67 and $86.82. This makes a clear technical picture: a breakout above resistance could signal a continuation, while a break below support would cancel the setup.
- Supportive Volume Action: A recent "Pocket Pivot" signal was noted, which is a price/volume pattern showing accumulation. This suggests institutional buying interest may be happening inside the consolidation range, adding a positive fundamental-technical layer.
A Possible Technical Situation
From this study, a technical trader might watch EW for a move above the noted resistance zone. The automated study in the report suggests a possible entry above $86.83 (a buy-stop order) with a first stop-loss placed below the support zone near $85.03. This sets the trade's risk at about 2.1% on the position. It is important to state that this is only an example made from the data; each trader must decide their own entry, exit, and position size based on their risk comfort and study.
Find More Possible Setups
The search process that found Edwards Lifesciences is used each day to the wider market. For investors looking for a selected list of stocks showing both good technicals and high-quality setups, you can see the present results using the Technical Breakout Setups screen.
Disclaimer: This article is for information only and does not make investment advice, a suggestion, or an offer or request to buy or sell any securities. The technical study and any described trade situations are based on automated data and are not made for any person's financial situation or risk comfort. All investing and trading include risk, including the possible loss of principal. Readers should do their own research and talk with a qualified financial professional before making any investment choices. Past results are not a guide to future results.