
For investors who use charts and price action to guide their choices, the search for promising opportunities often involves finding stocks that are both technically sound and ready for a move. One methodical way to do this is using a Technical Breakout screen, which finds equities showing two important traits: a high overall technical health score and a good consolidation pattern, or "setup." This method tries to find stocks that are already in clear uptrends but are taking a short pause, possibly giving a lower-risk entry point before their next rise.
Estée Lauder Companies Inc - CL A (NYSE:EL) recently appeared from such a screen, presenting a profile that technical traders may find interesting. The company, a global leader in prestige skincare, makeup, fragrance, and hair care, appears to be gaining momentum on the charts after a difficult time.
Looking at Technical Strength
The base of a breakout strategy is a stock's basic technical health. A high technical rating indicates a stock is in a clear uptrend across different timeframes, doing better than similar companies, and showing positive momentum. This is important because it raises the chance that a breakout from consolidation will keep going in the trend's current direction.
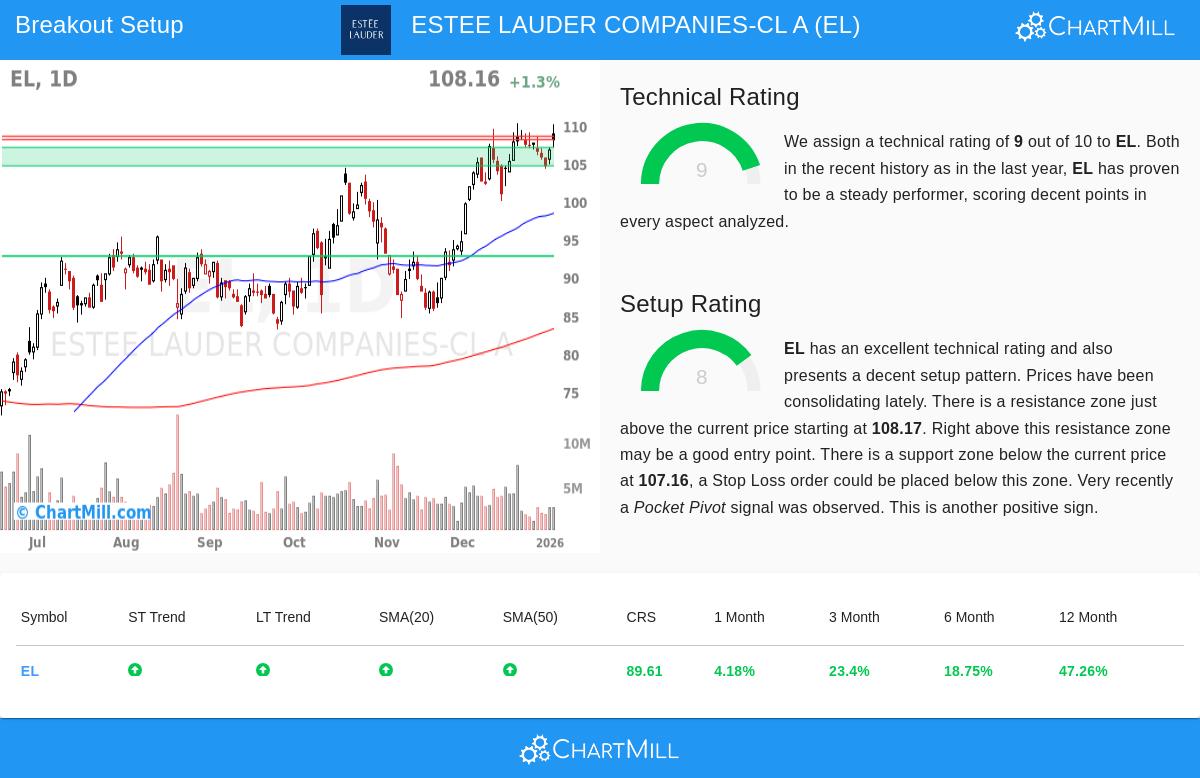
According to the detailed technical report, EL gets a solid technical rating of 9 out of 10. This score is backed by several positive factors:
- Trend Alignment: Both the long-term and short-term trends for EL are rated as positive. This agreement across timeframes is a typical sign of a good, continuing advance.
- Strong Relative Performance: The stock is doing better than 91% of similar companies in the Personal Care Products industry and 89% of all stocks in the market over the last year. This relative strength is an important sign of leadership.
- Position vs. Key Levels: EL is trading near its 52-week high, which is usually a positive sign, showing the stock is in an upward cycle. It is also trading above all its main moving averages (20, 50, 100, and 200-day), with each average itself in a rising pattern. This stacked alignment of support levels is a feature of a strong trend.
- Volume Profile: The stock keeps good average daily liquidity, and recent pullbacks have happened on lower volume, a good sign that points to a lack of heavy selling pressure during the consolidation.
Looking at the Setup Quality
While technical strength shows which stock to watch, the setup quality helps answer when to think about an entry. A high setup rating shows the stock is forming a tight, orderly consolidation pattern after its rise. This coiling action often comes before a new directional move and gives clearer levels for setting risk.
EL currently has a setup rating of 8, showing a good consolidation pattern. The analysis points to a "bull flag" formation, a common continuation pattern where prices pull back slightly in a narrow range after a strong rise. Important parts of this setup include:
- Defined Support and Resistance: The report finds a clear support zone between $104.72 and $107.16, made by a mix of moving averages and trendlines. Just above the current price, a resistance zone is between $108.17 and $108.65. These set boundaries create a clear plan for a possible trade.
- Recent Positive Signal: A "Pocket Pivot" signal was recently seen, which is a price move up on volume higher than the maximum down volume of the previous ten days. This can be an early sign of institutional buying during the consolidation phase.
- Actionable Trade Parameters: Based on this structure, the technical analysis suggests a possible breakout entry just above the resistance zone at about $108.66, with a protective stop loss placed below the support zone near $104.71. This sets the trade's risk from the start, a main idea of careful technical trading.
Conclusion
For technical investors, Estée Lauder presents a case where solid trend strength meets a clear consolidation pattern. The high technical rating confirms the stock's position in a continuing uptrend, while the high setup rating suggests it may be pausing before trying its next advance. The presence of clear, nearby support and resistance levels allows for a structured way to set entry and exit points, fitting with a risk-managed breakout strategy.
It is important to remember that technical patterns show probabilities, not guarantees. The wider market environment, where the S&P 500's long and short-term trends are also positive, gives a supportive background, but individual stock performance can always differ.
Looking for more possible breakout ideas? You can run the same Technical Breakout screen that found EL using this link to the ChartMill screener. New setups are created daily based on changing market conditions.
Disclaimer: This article is for information only and does not make up investment advice, a recommendation, or an offer to buy or sell any security. The analysis is based on technical data and patterns, which are not sure to predict future price movement. Always do your own research and think about your personal financial situation and risk tolerance before making any investment decisions.