
Discover EURONET WORLDWIDE INC (NASDAQ:EEFT)—an undervalued stock our stock screener has picked out. EEFT demonstrates solid fundamentals, including health and profitability, all while staying attractively priced. Let's explore the details.
Deciphering EEFT's Valuation Rating
ChartMill employs its own Valuation Rating system for all stocks. This score, ranging from 0 to 10, is determined by evaluating different valuation factors, including price to earnings and free cash flow, both in absolute terms and relative to the market and industry. EEFT has earned a 8 for valuation:
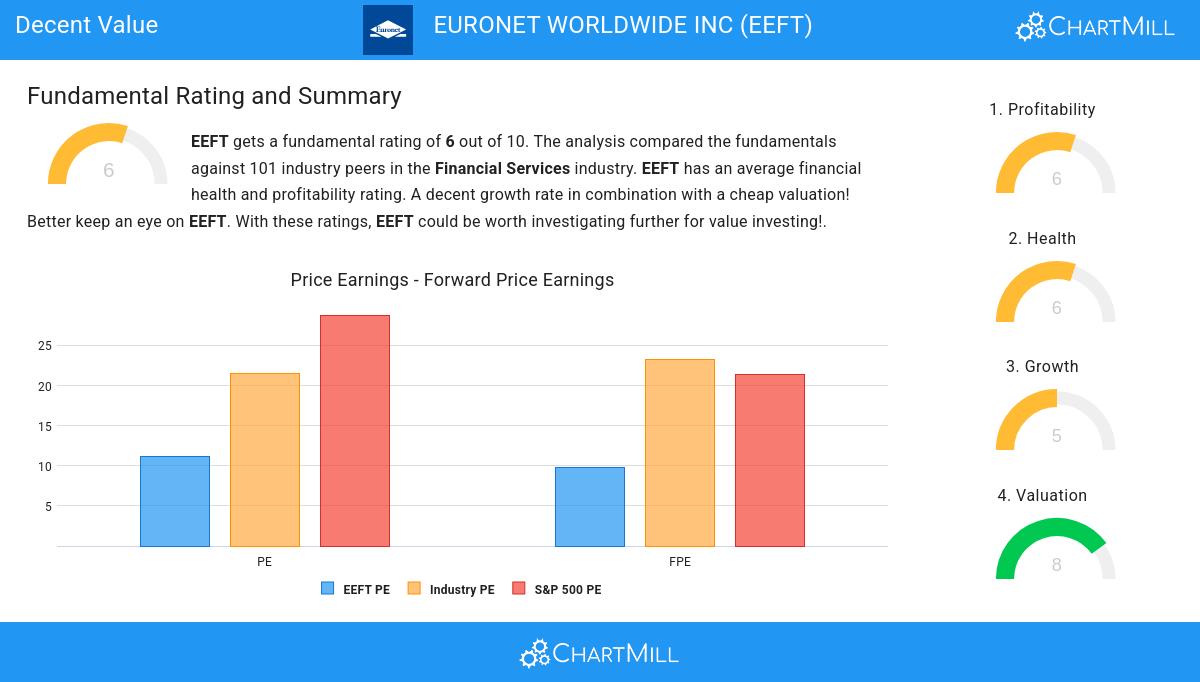
- The Price/Earnings ratio is 11.20, which indicates a very decent valuation of EEFT.
- EEFT's Price/Earnings ratio is a bit cheaper when compared to the industry. EEFT is cheaper than 60.40% of the companies in the same industry.
- When comparing the Price/Earnings ratio of EEFT to the average of the S&P500 Index (28.79), we can say EEFT is valued rather cheaply.
- The Price/Forward Earnings ratio is 9.84, which indicates a very decent valuation of EEFT.
- EEFT is valuated cheaply when we compare the Price/Forward Earnings ratio to 21.38, which is the current average of the S&P500 Index.
- Compared to the rest of the industry, the Enterprise Value to EBITDA ratio of EEFT indicates a rather cheap valuation: EEFT is cheaper than 86.14% of the companies listed in the same industry.
- Based on the Price/Free Cash Flow ratio, EEFT is valued cheaply inside the industry as 84.16% of the companies are valued more expensively.
- EEFT's low PEG Ratio(NY), which compensates the Price/Earnings for growth, indicates a rather cheap valuation of the company.
- The decent profitability rating of EEFT may justify a higher PE ratio.
- A more expensive valuation may be justified as EEFT's earnings are expected to grow with 14.22% in the coming years.
A Closer Look at Profitability for EEFT
ChartMill's Profitability Rating offers a unique perspective on stock analysis, providing scores from 0 to 10. These ratings consider a wide range of profitability metrics and margins, both in comparison to industry peers and on their own merits. For EEFT, the assigned 6 is a significant indicator of profitability:
- Looking at the Return On Assets, with a value of 5.24%, EEFT belongs to the top of the industry, outperforming 80.20% of the companies in the same industry.
- EEFT's Return On Equity of 24.90% is amongst the best of the industry. EEFT outperforms 88.12% of its industry peers.
- With an excellent Return On Invested Capital value of 13.31%, EEFT belongs to the best of the industry, outperforming 87.13% of the companies in the same industry.
- The last Return On Invested Capital (13.31%) for EEFT is above the 3 year average (10.46%), which is a sign of increasing profitability.
- The Gross Margin of EEFT (40.11%) is better than 61.39% of its industry peers.
What does the Health looks like for EEFT
ChartMill assigns a proprietary Health Rating to each stock. The score is computed by evaluating various liquidity and solvency ratios and ranges from 0 to 10. EEFT was assigned a score of 6 for health:
- EEFT has a Altman-Z score of 2.16. This is in the better half of the industry: EEFT outperforms 79.21% of its industry peers.
- The Debt to FCF ratio of EEFT is 3.24, which is a good value as it means it would take EEFT, 3.24 years of fcf income to pay off all of its debts.
- With a decent Debt to FCF ratio value of 3.24, EEFT is doing good in the industry, outperforming 70.30% of the companies in the same industry.
- EEFT's Current ratio of 1.25 is fine compared to the rest of the industry. EEFT outperforms 62.38% of its industry peers.
- The Quick ratio of EEFT (1.25) is better than 63.37% of its industry peers.
Growth Analysis for EEFT
ChartMill assigns a proprietary Growth Rating to each stock. The score is computed by evaluating various growth aspects, like EPS and revenue growth. We take into account the history as well as the estimated future numbers. EEFT was assigned a score of 5 for growth:
- EEFT shows a strong growth in Earnings Per Share. In the last year, the EPS has been growing by 15.20%, which is quite good.
- The Revenue has grown by 8.18% in the past year. This is quite good.
- Based on estimates for the next years, EEFT will show a quite strong growth in Earnings Per Share. The EPS will grow by 14.22% on average per year.
- The EPS growth rate is accelerating: in the next years the growth will be better than in the last years.
Our Decent Value screener lists more Decent Value stocks and is updated daily.
Check the latest full fundamental report of EEFT for a complete fundamental analysis.
Disclaimer
Important Note: The content of this article is not intended as trading advice. It is essential to perform your own analysis and exercise caution when making trading decisions. The article presents observations created by automated analysis but does not guarantee any trading or investment outcomes. Always trade responsibly and make independent judgments.