
DexCom Inc (NASDAQ:DXCM) has appeared as a notable candidate through a screening method that mixes technical and fundamental analysis to find good growth stocks showing positive technical breakout patterns. This method focuses on companies with good growth numbers, firm profitability, and acceptable financial condition, while also displaying consolidation or new patterns on technical charts that indicate possible upward movement. The idea behind this two-part analysis is to find stocks with both basic business health and positive market timing, possibly offering chances for price increases as they move out of set trading ranges.
From a fundamental view, DexCom shows a positive growth profile. The company, which focuses on continuous glucose monitoring systems for diabetes management, has shown good historical revenue growth, averaging 22.27% each year over recent years. While recent quarterly EPS showed a small drop of -2.86%, the company keeps a notable record with 29.25% average yearly EPS growth over several years. Future estimates stay hopeful with expected EPS growth of 23.00% and revenue growth of 14.08% each year. These growth traits are important for finding companies with lasting expansion possibility, a key part of growth investment methods.
The fundamental analysis report shows several positives that match growth stock standards. DexCom gets a high profitability score of 9/10, doing better than industry competitors across multiple measures including return on equity (22.21%), return on invested capital (14.52%), and operating margin (17.22%). The company's financial condition score of 5/10 shows some issues with liquidity ratios but keeps sufficient solvency with an Altman-Z score of 5.60 showing low bankruptcy risk. Valuation gives a mixed view with a P/E ratio of 48.04 that seems high in absolute terms but compares well against industry competitors, trading at a lower price than 68.98% of companies in the health care equipment sector.
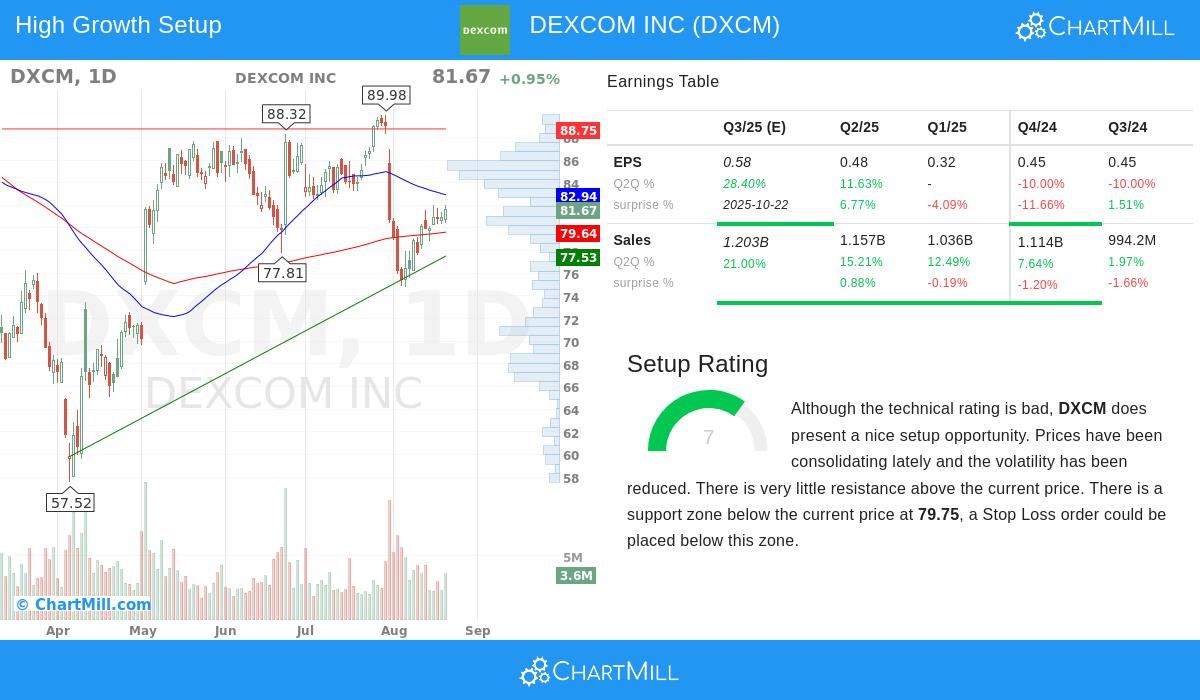
Technically, DexCom shows encouraging traits even with a neutral total score. The stock has been consolidating within a set range between about $75 and $90, with lower volatility indicating possible energy building for a large move. The setup score of 7/10 indicates the stock is making a positive pattern with support seen around $79.75 and falling resistance above current levels. This technical formation is especially important for growth stocks as breakouts from consolidation patterns often come before faster price movements, possibly catching the momentum that growth investors look for.
The mix of good fundamental growth measures with forming technical patterns makes DexCom an interesting case in growth stock selection. The company works in the increasing diabetes management market, dealing with a rising global health issue with new technology. This market position backs the qualitative parts of growth investing, including target market size and growth possibility, while the numerical measures show ability to perform. The technical setup indicates market players may be noticing these fundamental positives, with price action starting to show the basic business quality.
For investors curious about finding similar chances, more screening results using this mixed technical and fundamental method can be found through this growth stock screener.
Disclaimer: This analysis is given for information only and should not be taken as investment advice. Investors should do their own research and talk with financial professionals before making investment choices. Past performance does not ensure future results, and all investments have risk including possible loss of principal.