
For investors who use technical analysis to find possible opportunities, the search often comes to two main questions: which stock is in a strong trend, and when is the right time to buy it? A methodical way to answer these questions uses a filter for stocks that show both good technical condition and a clear, usable price pattern. One technique joins a high "Technical Rating," which measures the strength and direction of a stock's trend, with a high "Setup Quality Rating," which finds times of price stability that frequently come before a new price move. This pairing tries to find breakout patterns inside the market's best performers, giving an organized plan for entry.
Devon Energy Corp (NYSE:DVN) recently appeared from this kind of filtering process, showing a profile that technical investors may see as interesting. The independent energy company, centered on exploration and production in main U.S. areas like the Delaware and Anadarko, displays traits that match the breakout method's central ideas.
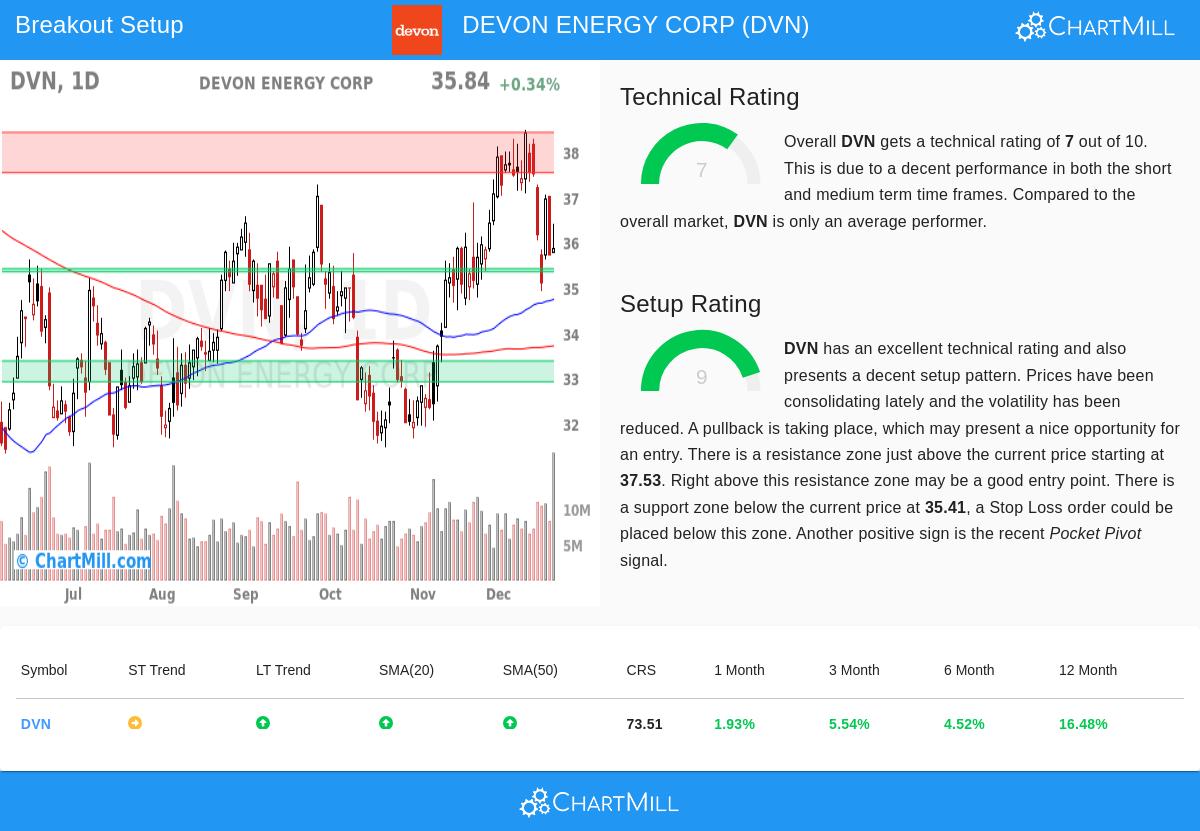
Looking at the Technical Base
The first part of the method is a stock's basic technical strength, making sure it is already in a positive trend before a period of stability. Devon Energy's technical profile, as shown in its ChartMill Technical Report, backs this idea with a firm rating of 7 out of 10. This number shows a mostly sound trend structure when looking at several time periods and measures.
Important technical points include:
- Trend Position: The long-term trend is seen as positive, while the short-term trend is neutral. This arrangement often points to a stock in a longer-term upward trend that is resting or stabilizing, a common sign of a possible continued move.
- Relative Performance: The stock does better than 73% of all stocks over the last year and 72% of similar companies in the Oil, Gas & Consumable Fuels industry. This shows relative good performance, a key point for the "which stock" question, as top performers often remain top performers.
- Moving Average Support: The stock is trading above its important rising moving averages (20, 50, 100, and 200-day), pointing to wide support from different investor timeframes. The nearness of the current price to the 20-day moving average is a good signal for the setup condition, which will be covered next.
Judging the Setup Condition
A strong trend by itself is not a signal to buy; entering after a fast price increase has danger. The method's second part looks for a good stability pattern, which gives a more defined entry point and a sensible place for a protective stop-loss order. This is where Devon Energy's profile gets especially notable, as it receives a high Setup Quality Rating of 9.
The setup review shows the stock is making a hopeful pattern:
- Stability Happening: The report states that prices have been stabilizing recently with lower price swings. Over the last month, DVN has traded in a band between about $34.78 and $38.48, and it is now trading in the middle of this band. This tightening action often comes before a clear breakout.
- Set Support and Resistance: The review finds clear, multiple support areas below the current price, starting near $35.41. Above, a set resistance area exists between $37.53 and $38.42. These points give specific reference levels for planning a trade, a possible entry on a breakout above resistance and a stop-loss set below support.
- Supporting Volume Activity: A recent "Pocket Pivot" signal was seen, which is a volume-based pattern indicating buying by larger participants during a price rise. This can be a confirming element for the condition of the setup.
A Possible Trade Plan
Built on this joined review of technical strength and setup condition, the automatic report proposes a specific, though example-only, trade plan. It suggests an entry point just above a key moving average at $36.83, with a stop-loss order set at $35.33 below the closest support area. This would cap the example risk on the trade to about 4.1%. It is very important to note that this is an example setup created from the technical factors; investors must always do their own review, change levels to fit their own risk comfort, and include basic factors like coming earnings or commodity price changes.
The wider market situation, with the S&P 500 showing a positive short-term trend, gives a generally good background for such technical setups to form.
Locating Other Possibilities
Devon Energy is one present case of a stock fitting the needs for a technical breakout setup. Investors wanting to find other possible opportunities that pass similar filters can view the current results of the Technical Breakout Setups filter here. This filter constantly searches the market for stocks with high technical and setup ratings, acting as a beginning point for more investigation.
Disclaimer: This article is for information only and is not investment advice, a suggestion, or an offer to buy or sell any security. The trade setup talked about is an automatic, example case and should not be seen as a specific suggestion. All investing and trading has risk, including the possible loss of money. Readers should do their own research, think about their personal money situation, and talk with a qualified financial advisor before making any investment choices. Past results do not guarantee future results.