
DELL TECHNOLOGIES -C (NYSE:DELL) has been identified as a potential breakout candidate by our technical screener. The stock shows a combination of strong technical health and a well-defined consolidation pattern, making it worth a closer look for traders. Below, we break down the key factors supporting this setup.
Technical Strength
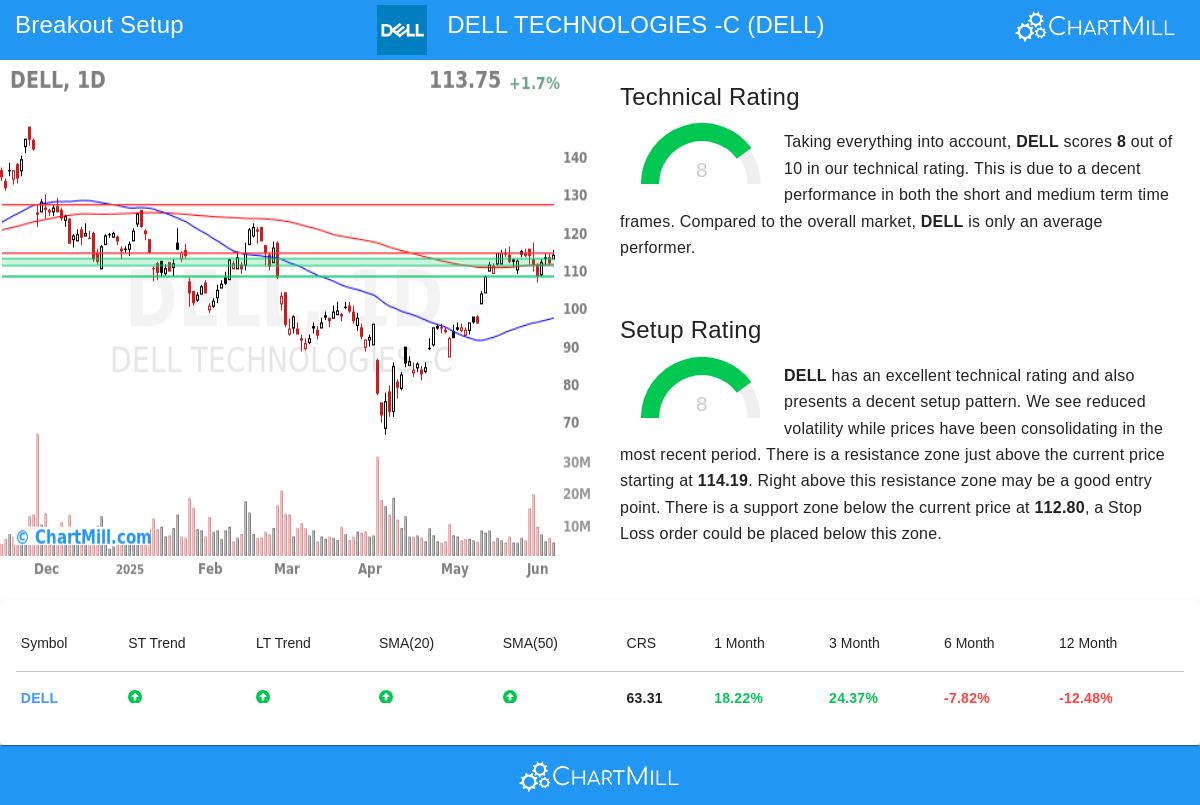
- Trends: Both the short-term and long-term trends for DELL are positive, reinforcing the stock’s upward momentum.
- Relative Strength: DELL outperforms 80% of stocks in the Technology Hardware, Storage & Peripherals industry, indicating strong sector leadership.
- Moving Averages: The stock is trading above its 20-day, 50-day, 100-day, and 200-day moving averages, a bullish signal.
- Volume: With an average daily volume of 7.8 million shares, liquidity is strong, reducing slippage risk for traders.
Setup Quality
- Consolidation: Prices have been consolidating recently, reducing volatility and forming a potential bull flag pattern.
- Support & Resistance: A clear support zone exists between $110.93 and $112.80, while resistance sits near $114.19. A breakout above resistance could signal further upside.
- Entry & Exit Points: The setup suggests an entry at $114.29 (just above resistance) and a stop-loss at $110.92 (below support), offering a defined risk-reward ratio.
For a deeper technical breakdown, review the full technical report for DELL.
Our Technical Breakout Setups screener updates daily with new potential opportunities.
Disclaimer
This is not investment advice. Always conduct your own analysis and consider risk management before trading.