
For investors who use technical analysis to find possible opportunities, a common plan involves locating stocks that are both technically sound and ready for a move soon. This often means looking for equities that show a good basic trend but are now in a period of sideways movement, giving a more distinct entry point with understood risk. One way to organize this search is by using specialized ratings like ChartMill's Technical Rating and Setup Quality Score. The Technical Rating judges the general condition and trend force of a stock, while the Setup Quality Score checks if the present price action is making a clear, calm pattern that might come before a breakout. A stock that does well on both measures can make a strong argument for technical investors.
A recent search using this approach has pointed to Clearwater Analytics HDS-A (NYSE:CWAN) as an example showing these traits. The cloud-based investment accounting and analytics company displays a mix of positive trend behavior and a narrowing price formation that frequently comes before a notable move.
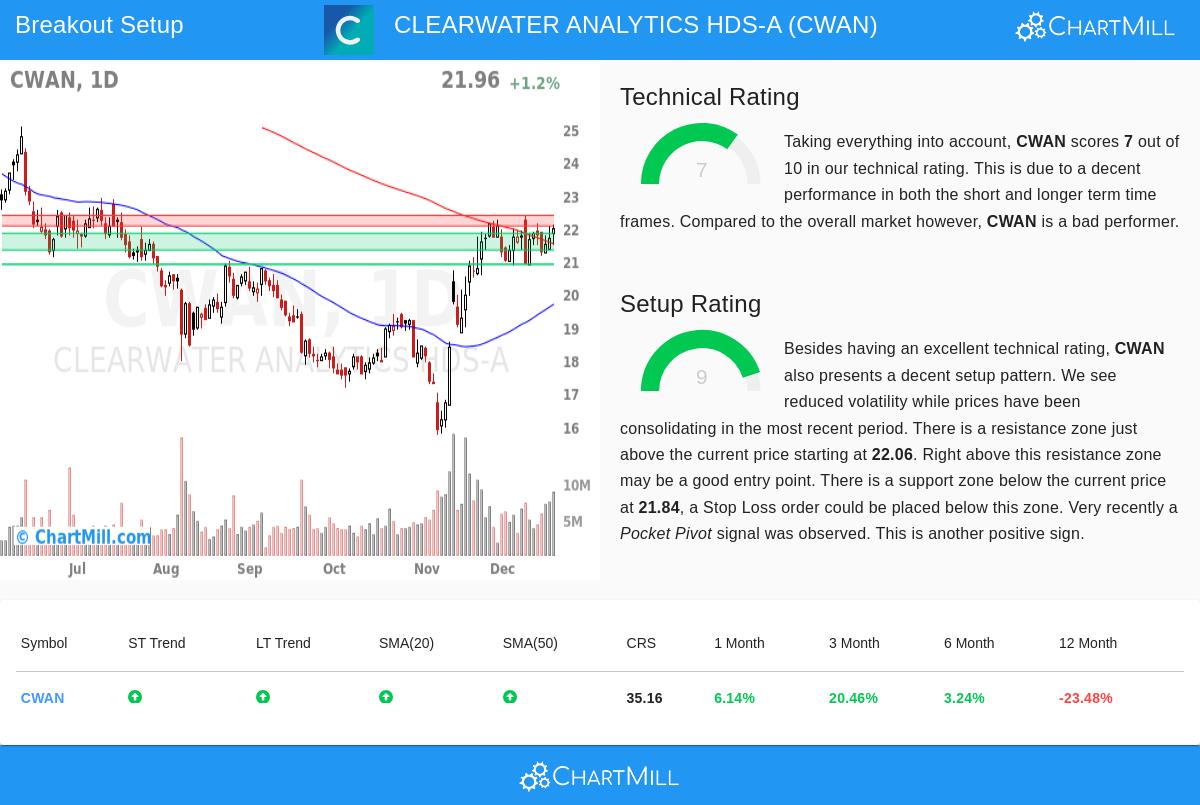
Looking at the Technical Base
The main screen in a breakout search is a stock's basic technical condition, as a solid trend supplies the force required for a good breakout. Clearwater Analytics receives a ChartMill Technical Rating of 7, which labels it as a stock in a verified uptrend. This score is important because it verifies the stock's medium-to-long-term path is positive, raising the chance that a breakout will keep going in the current trend direction.
A more detailed view of the detailed technical report shows the supports of this rating:
- Positive Trend Agreement: Both the long-term and short-term trends for CWAN are scored as positive. This agreement across different periods points to steady buying interest.
- Good Industry Position: Inside the active Software industry, CWAN does better than 71% of its 280 competitors, showing comparative force that can be a mark of professional investor attention.
- Helpful Moving Averages: The stock is priced above important short- and medium-term moving averages (the 20-day, 50-day, and 100-day SMAs), which are all increasing. This forms a line of changing support levels below the price.
While the stock's one-year result is behind the wider market, its more current three-month increase of over 20% marks a big change in force, which the Technical Rating successfully records.
Judging the Setup Quality
A solid trend by itself is not sufficient; a good setup needs a period of sideways movement where price swings lessen and the stock stores energy for its next rise. This is where the Setup Quality Score becomes key, as it finds times of close trading that give more distinct entry and stop-loss points. CWAN has a high Setup Rating of 9, meaning a very good sideways pattern is present.
The technical report explains why the setup is interesting:
- Sideways Movement and Lowered Swings: Prices have been trading in a small band lately, a typical mark of sideways action after the stock's rise. This coiling behavior often comes before a directional move.
- Clear Price Points: The analysis finds a definite resistance area between $22.06 and $22.38. A clear move above this area could mark the beginning of a new uptrend part. On the other hand, a firm support area exists between $21.33 and $21.84, giving a reasonable place to set a protective stop-loss order.
- Supportive Signs: The report also mentions a recent "Pocket Pivot" signal, a volume-based formation that hints at buying by bigger investors during the sideways phase, adding a note of confirmation to the setup.
This pairing—a stock in a firm uptrend taking a break to form a base—creates the kind of practical situation technical investors look for. The high Setup Rating measures the condition of this pause, indicating the stock is not overbought but instead getting ready for its next action.
A Specific Trading Plan
Using the set support and resistance, the analysis proposes a possible trading setup. An entry might be thought about on a breakout above the resistance area, for example with a buy-stop order at $22.39. A stop-loss order could then be set below the support area at $21.32, capping the idea-based risk on the trade to about 4.8%. This plan shows how the two ratings work together: the Technical Rating gives trust in the direction, while the Setup Rating aids in finding the timing and risk limits.
Locating Comparable Chances
The search that found Clearwater Analytics is done each day to show new possible breakout setups. Investors wanting to see the present list of stocks that fit similar conditions of sound technicals and good-quality setups can view the results directly using the Technical Breakout Setups screen.
Disclaimer: This article is for information only and is not investment advice, a suggestion, or an offer to buy or sell any security. The trading setup described is an automatic, idea-based example built on technical signs and is not a promise of future results. Investing has risk, including the possible loss of original money. Always do your own study, think about your money situation and risk comfort, and talk with a registered financial advisor before making any investment choices.