
For growth-minded investors, high revenue and EPS growth are key criteria. Today, we'll examine whether CLEARWATER ANALYTICS HDS-A (NYSE:CWAN) fits the bill for growth investing, particularly as it forms a base and hints at a potential breakout. Remember, due diligence is essential, but CLEARWATER ANALYTICS HDS-A has caught our attention on our screen for growth with base formation. It may warrant additional investigation.
What does the Growth looks like for CWAN
ChartMill assigns a Growth Rating to each stock, ranging from 0 to 10. This rating is determined by analyzing different growth elements, including EPS and revenue growth, spanning both historical and future figures. In the case of CWAN, the assigned 9 reflects its growth potential:
- The Earnings Per Share has grown by an impressive 32.35% over the past year.
- CWAN shows a strong growth in Earnings Per Share. Measured over the last years, the EPS has been growing by 110.89% yearly.
- The Revenue has grown by 22.72% in the past year. This is a very strong growth!
- Measured over the past years, CWAN shows a very strong growth in Revenue. The Revenue has been growing by 21.88% on average per year.
- CWAN is expected to show a strong growth in Earnings Per Share. In the coming years, the EPS will grow by 24.92% yearly.
- The Revenue is expected to grow by 19.23% on average over the next years. This is quite good.
Unpacking CWAN's Health Rating
ChartMill assigns a Health Rating to every stock. This score ranges from 0 to 10 and evaluates the different health aspects like liquidity and solvency, both absolutely, but also relative to the industry peers. CWAN scores a 7 out of 10:
- CWAN has an Altman-Z score of 26.31. This indicates that CWAN is financially healthy and has little risk of bankruptcy at the moment.
- The Altman-Z score of CWAN (26.31) is better than 94.98% of its industry peers.
- The Debt to FCF ratio of CWAN is 0.66, which is an excellent value as it means it would take CWAN, only 0.66 years of fcf income to pay off all of its debts.
- The Debt to FCF ratio of CWAN (0.66) is better than 74.91% of its industry peers.
- CWAN has a Debt/Equity ratio of 0.04. This is a healthy value indicating a solid balance between debt and equity.
- A Current Ratio of 4.99 indicates that CWAN has no problem at all paying its short term obligations.
- Looking at the Current ratio, with a value of 4.99, CWAN belongs to the top of the industry, outperforming 86.38% of the companies in the same industry.
- A Quick Ratio of 4.99 indicates that CWAN has no problem at all paying its short term obligations.
- CWAN has a Quick ratio of 4.99. This is amongst the best in the industry. CWAN outperforms 86.38% of its industry peers.
Looking at the Profitability
ChartMill assigns a proprietary Profitability Rating to each stock. The score is computed by evaluating various profitability ratios and margins and ranges from 0 to 10. CWAN was assigned a score of 6 for profitability:
- The Return On Assets of CWAN (36.28%) is better than 98.92% of its industry peers.
- CWAN's Return On Equity of 42.09% is amongst the best of the industry. CWAN outperforms 94.27% of its industry peers.
- With a decent Return On Invested Capital value of 0.88%, CWAN is doing good in the industry, outperforming 64.87% of the companies in the same industry.
- The Profit Margin of CWAN (93.93%) is better than 97.13% of its industry peers.
- In the last couple of years the Profit Margin of CWAN has grown nicely.
- Looking at the Operating Margin, with a value of 2.71%, CWAN is in the better half of the industry, outperforming 67.38% of the companies in the same industry.
- CWAN has a better Gross Margin (72.78%) than 61.65% of its industry peers.
How does the Setup look for CWAN
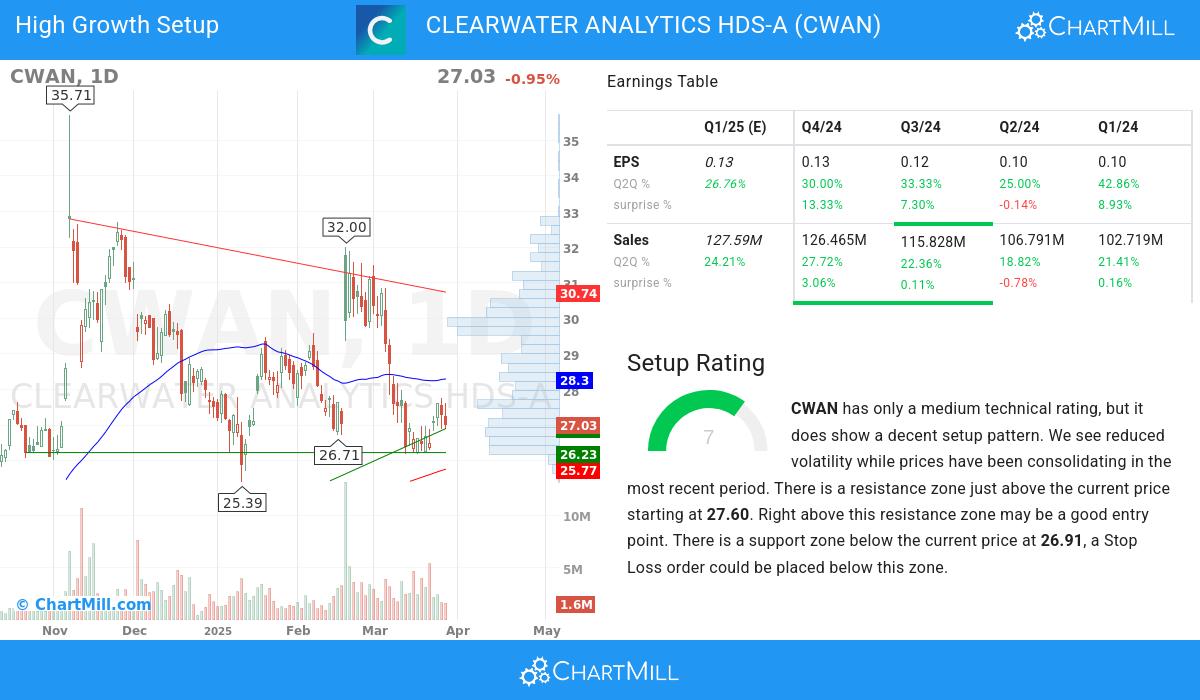
ChartMill incorporates a Setup Rating in its analysis, which measures the extent of consolidation in a stock over recent days and weeks. This rating, ranging from 0 to 10, is updated daily and takes into account multiple short-term technical indicators. The current setup rating for CWAN is 7:
CWAN has only a medium technical rating, but it does show a decent setup pattern. Prices have been consolidating lately and the volatility has been reduced. There is a resistance zone just above the current price starting at 27.60. Right above this resistance zone may be a good entry point. There is a support zone below the current price at 26.91, a Stop Loss order could be placed below this zone.
Our Strong Growth screener lists more Strong Growth stocks and is updated daily.
Check the latest full fundamental report of CWAN for a complete fundamental analysis.
For an up to date full technical analysis you can check the technical report of CWAN
Disclaimer
This article should in no way be interpreted as advice. The article is based on the observed metrics at the time of writing, but you should always make your own analysis and trade or invest at your own responsibility.