
In equity investing, using both fundamental and technical analysis can be a good method for finding opportunities. One way is to look for stocks with good business progress, backed by sound finances and earnings, that also have positive chart behavior indicating a possible upward move. This process tries to match a company's operational strength with a positive market signal, intending to participate as a stock moves from a period of stability to a rising trend. The aim is to find companies where better business results might soon be noticed and valued by the market.
Commvault Systems Inc (NASDAQ:CVLT) is a present example for this method. The data protection and cyber resilience software firm was found by a filter made to locate good growth stocks with positive chart formations. We will look at why CVLT is on this list by reviewing its business strengths and recent chart activity.
Fundamental Growth Profile
The filtering method first chooses companies with clear and anticipated growth. CVLT’s fundamental report points to a good growth path, which is the main driver for any growth stock idea.
- Past Performance: The firm has posted good recent numbers. Revenue rose by 22.02% over the last year, while Earnings Per Share (EPS) went up by 19.69%. The average yearly EPS growth in recent years is a solid 20.11%.
- Future Expectations: Growth is not only about the past. Analysts forecast more progress, with estimated yearly EPS growth of 14.30% and revenue growth of 9.98% in future years. It is significant that the estimated revenue growth rate is increasing relative to its past average.
- Profitability and Health: For growth to last, it needs a stable financial base. CVLT gets a 7 out of 10 for Profitability, helped by high gross margins over 81% and better operating margins. Its Financial Health score is a neutral 6, aided by very good liquidity ratios (Current and Quick Ratios of 2.53) but affected by a debt-to-equity ratio above average. A key point is its positive operating cash flow.
This mix, strong past growth, positive future estimates, and acceptable profitability, creates the business foundation of the idea. You can see all the information in the Commvault Fundamental Analysis report.
Technical Setup and Price Action
While fundamentals explain the "why," technical analysis aids with the "when." The filter looks for stocks where this business strength is paired with a price chart formation hinting at growing interest and a possible near-term move up. CVLT’s chart shows a varied but interesting formation.
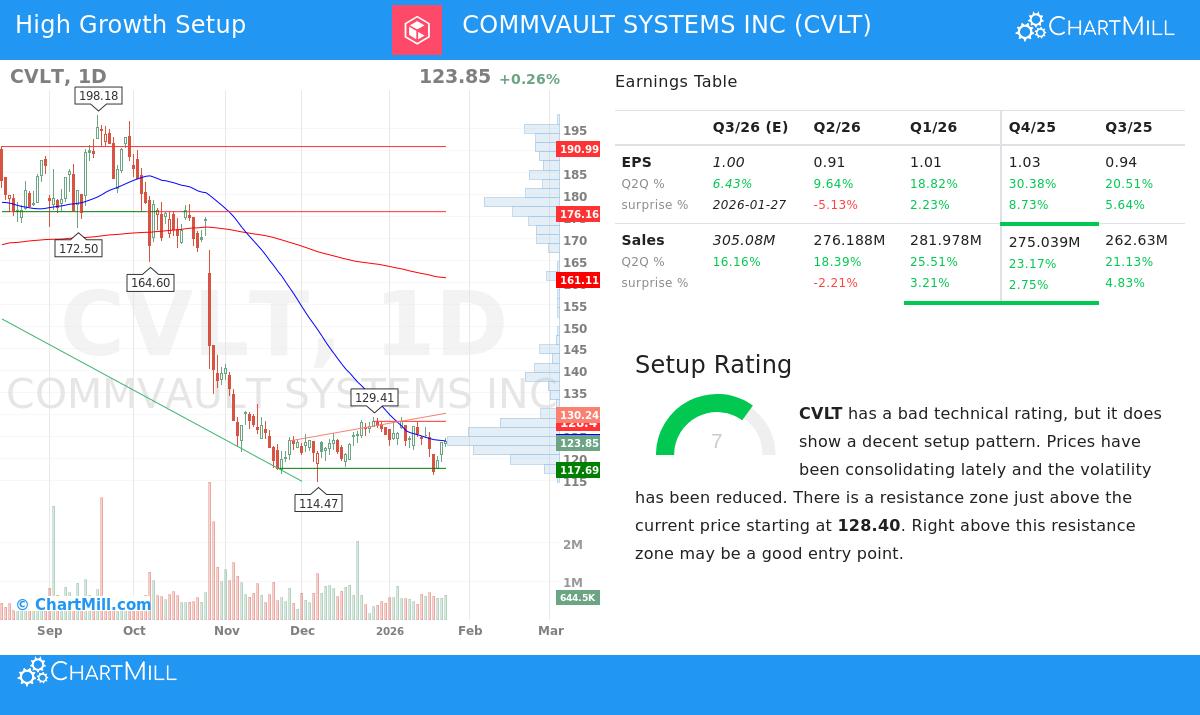
- Stability in a Range: After a large drop from its 52-week peaks, CVLT’s price activity has lately entered a time of lower volatility and stability. In the last month, it has moved between about $116 and $129, establishing a floor in this area.
- Important Resistance Level: The technical analysis notes a clear and nearby resistance area just above the present price, from $128.40 to $128.47. This zone is created by a combination of trendlines and is a main barrier the stock must pass.
- The Formation Chance: This is where the chart formation rating of 7 matters. The idea proposes that a clear move above this specific resistance area, ideally with more trading volume, could mark the close of the stability phase and the start of a new rising trend. The formation indicates the stock is "tightening" near resistance, and a breakout would verify that buying is finally exceeding selling.
The present negative short- and long-term trends mentioned in the report are a note of care, showing the stock is in a rebound phase. However, the method specifically searches for these recovery or breakout formations in such situations. The complete chart view, with support and resistance levels, is in the Commvault Technical Analysis report.
Valuation Context
For a growth stock, price is always a key factor. CVLT’s valuation rating is a neutral 4. Its P/E ratio of 31.84 is about equal to the wider S&P 500 but seems more moderate next to many software industry companies. The forward P/E of 26.78 is also near the market average. While not very low, the price is not high, particularly when viewed next to its good growth rates and profit margins. This middle ground stops it from being seen as too expensive, which is necessary for the method to avoid stocks where all future growth is already reflected in the price.
Conclusion
Commvault Systems displays a profile that fits a growth-and-breakout filtering method. On business terms, it shows increasing revenue, good earnings growth, and firm profitability. On the chart, it is stabilizing after a decline and is near a specific resistance level that, if passed, could signal a change in momentum. The relationship between these two reviews creates the investment idea: a company with growing business results might be near getting recognition on the chart.
It is important to recall that a chart formation is a possible trigger, not a certainty. Investors should watch the $128.40-$128.47 resistance level carefully for a verified, high-volume move above as a potential entry point, while always noting the wider market situation and the company's next earnings reports.
If you want to see other stocks that match this approach of solid growth paired with positive chart formations, you can use the filter yourself here: Strong Growth Stock Technical Setups Screen.
Disclaimer: This article is for information only and is not financial advice, a suggestion, or an offer or solicitation to buy or sell any securities. The review uses data and reports thought to be dependable, but its correctness is not assured. Investing has risk, including the possible loss of capital. You should do your own research and talk to a qualified financial advisor before making any investment choices.