
In the search for market-beating returns, many investors focus on a dual approach: identifying companies with solid underlying business growth while also pinpointing favorable entry points on the price chart. This strategy aims to combine the long-term potential of fundamental strength with the shorter-term timing signals of technical analysis. A screen for "Strong Growth Stocks with good Technical Setup Ratings" puts this idea into practice, filtering for companies showing accelerating earnings and sales, firm profitability, and sound finances, all while their stock charts indicate a possible breakout from a period of consolidation. The goal is to find securities where significant business momentum may be close to being acknowledged and reflected in the share price.
Commvault Systems Inc (NASDAQ:CVLT) appears from such a screen, presenting a case where notable fundamental growth metrics meet a technical chart pattern that suggests a possible turning point. The data protection and cyber resilience specialist has been operating in a competitive software field, and an examination of its reports indicates the company is establishing a base for continued growth.
Fundamental Growth Profile
At its center, the growth investing strategy looks for companies performing better than their peers, and Commvault’s fundamental report shows it is achieving this in important areas. The company receives a firm Growth Rating of 8 out of 10, supported by notable recent performance and positive forward expectations.
- Past Performance: Revenue increased by 22.02% over the past year, a rate described as "very strong." Meanwhile, Earnings Per Share (EPS) grew by 19.69% last year and has averaged an annual growth rate of 20.11% over recent years.
- Future Expectations: Analysts expect this momentum to persist, with EPS projected to grow at an average of 14.30% annually and Revenue forecast to rise by 9.98% per year in the coming periods. Importantly, the projected revenue growth is speeding up compared to its historical average.
- Profitability and Health: Supporting this growth story are firm scores for Profitability (7/10) and Financial Health (6/10). The company has excellent gross margins above 81% and firm returns on equity. Its balance sheet indicates good liquidity with a sound current ratio, though it holds a significant amount of debt. This mix of high growth, firm margins, and acceptable financial health is exactly the fundamental profile growth investors examine, as it indicates the company can finance its growth without undue risk.
You can review the full details of this analysis in the Commvault Fundamental Analysis Report.
Technical Setup and Breakout Potential
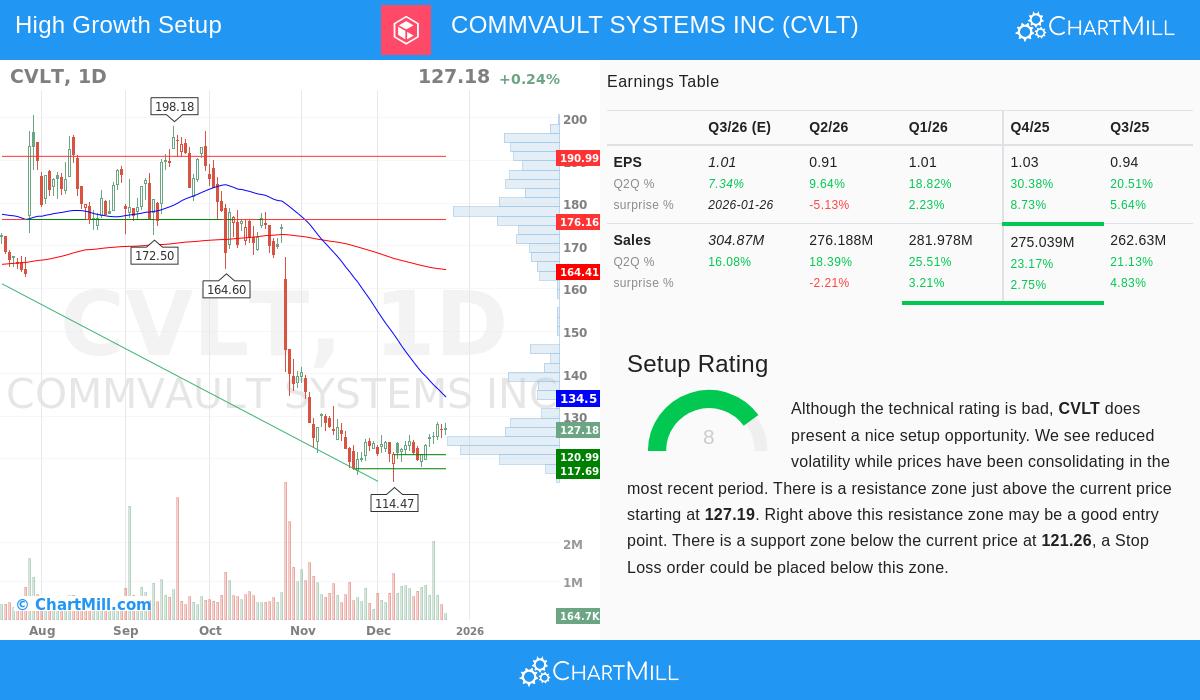
While fundamentals explain the "why," technical analysis can help pinpoint the "when." Commvault’s technical picture has been difficult, with a low overall rating reflecting a major decline from its 52-week highs. However, within this wider context, the report notes a notable short-term setup with a high rating of 8 out of 10.
The stock has been moving in a range between approximately $114.50 and $128.80 over the past month, displaying lower volatility after a time of decline. It is currently trading near the top of this range. The technical analysis notes a clear resistance zone just above the current price, spanning from $127.19 to $128.16. A clear move above this resistance level on high volume could indicate a breakout, possibly ending the near-term downtrend and creating a way for a move higher. In contrast, a defined support zone exists around $121.26, which could act as a logical area for a stop-loss order if a breakout attempt does not succeed. This pattern of consolidation near resistance, after a downtrend, is a common chart setup that technical traders watch for signals of a trend change or a significant bounce.
For a visual representation of these key levels, see the Commvault Technical Analysis Report.
Valuation Context
For growth investors, valuation is often less important than growth rate, but it remains a key check on reasonableness. Commvault’s valuation rating is neutral at 4/10. Its Price-to-Earnings (P/E) ratio seems high in absolute terms but is actually lower than many of its software industry peers. The forward P/E ratio is similar to the broader S&P 500 average. This indicates that while the stock is not inexpensive, its valuation is not excessive relative to its market and sector, particularly when viewed next to its better growth and profitability metrics. The growth path may support its current multiples if performance continues.
Conclusion
Commvault Systems presents an interesting mix of traits for investors using a growth-with-timing strategy. Fundamentally, the company is showing firm and speeding up revenue growth paired with excellent profitability, important criteria for any growth stock selection. Technically, after a large pullback, the stock is indicating signs of steadiness and is testing a level that might start a breakout, offering a specific risk/reward situation. This meeting of a strong business engine and a possibly favorable chart pattern is what screens like the "Strong Growth Stocks with good Technical Setup Ratings" are made to find.
Interested in examining other stocks that match this specific growth-and-setup profile? You can run the screen yourself and see the current results by following this link: Strong Growth Stock Technical Setups Screen.
,
Disclaimer: This article is for informational and educational purposes only and does not constitute a recommendation to buy, sell, or hold any security. The analysis is based on data and reports provided by ChartMill, and investors should conduct their own due diligence and consult with a qualified financial advisor before making any investment decisions. Past performance is not indicative of future results.