
A screening method that uses both fundamental and technical analysis can help investors find companies with good basic business measures while also locating good entry points based on price movements. This method tries to match a company's financial condition and growth path with market timing, with the goal of buying stocks that are set to rise. The plan concentrates on securities showing good growth, firm profitability, and acceptable financial condition from a fundamental view, while also showing technical breakout patterns that point to a possible finish of a sideways phase and the start of a new rising trend.
Fundamental Growth Profile
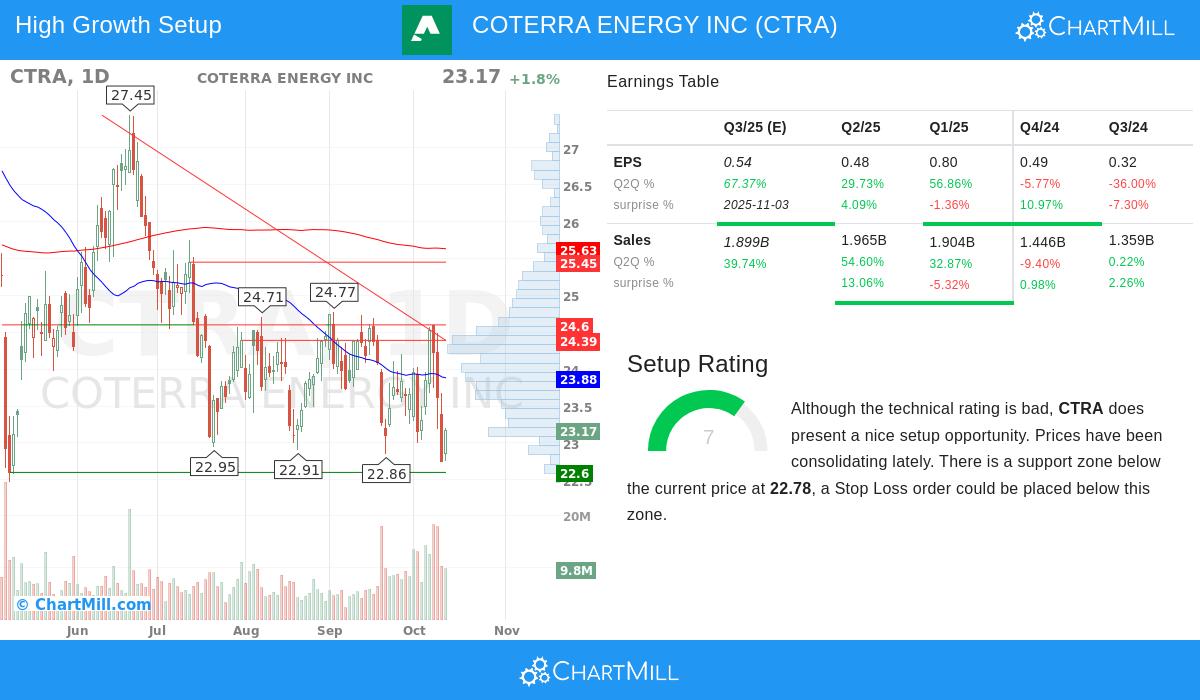
COTERRA ENERGY INC (NYSE:CTRA) presents a positive fundamental case, especially in the growth group where it gets a score of 7 out of 10. The company's revenue growth has been a notable feature, showing good speed both lately and over a longer period.
- Revenue Growth: The company reported a 17.10% rise in revenue over the last year, adding to a very good historical average yearly growth rate of 21.44% over the last several years.
- Earnings Growth: Looking ahead, analysts predict good growth with Earnings Per Share (EPS) expected to rise by 14.42% each year, showing that the strong business results are likely to keep going.
- Growth Acceleration: A good sign for momentum investors is the quickening growth pattern, where the expected future EPS growth rate is higher than the growth rate of the last several years.
This good growth is a main part of the screening plan, as companies with quickening revenues and earnings are often given higher values by the market. The complete fundamental analysis report for CTRA gives a more detailed look at these measures.
Profitability and Valuation Assessment
Besides growth, Coterra Energy also shows acceptable profitability and a good valuation. The company gets a profitability score of 7, supported by margins that are good when compared to others in its industry.
- Profitability Measures:
- Gross Margin: 82.52%, doing better than 92% of similar companies.
- Operating Margin: 31.25%, better than 76% of the industry.
- Return on Invested Capital (ROIC): 7.30%, higher than 66% of competitors.
- Valuation Attractiveness:
- P/E Ratio: 11.09, which is seen as very fair and less expensive than 69% of the industry.
- Forward P/E Ratio: 6.76, showing a rather low price compared to both the industry and the wider S&P 500.
This mix of good growth and a low price is a main goal for this investment plan. It suggests the market may not be completely valuing the company's future earnings possibility, making a possible chance for investors.
Financial Health and Technical Setup
While the company's financial health score is a middle 5, it displays several stability strengths. The Debt/Equity ratio of 0.29 shows an acceptable balance between debt and equity, and the company does better than a majority of its peers in this area. This gives a base of steadiness for a growth-focused company.
From a technical view, the overall score is low because of negative short and long-term directions. However, the more detailed technical analysis report for CTRA shows a hopeful "setup rating" of 7 out of 10. This points out an important difference within the screening method: it looks for stocks that might be coming out of a downward or sideways period, not only those already in a strong upward trend.
- Consolidation Pattern: The stock has been trading in a set area between about $22.75 and $24.69 over the last month and is now close to the lower part of this area.
- Key Support Level: An important support zone has been found between $22.60 and $22.78, made by a coming together of several trend lines.
- Breakout Possibility: The screen sees this kind of price movement as a possible pause before a new move. A bounce from the support level on high volume could mark the beginning of a technical breakout, matching the price movement with the good fundamental story.
Conclusion
COTERRA ENERGY INC represents an interesting case where a good fundamental growth profile and good valuation meet with a technical chart pattern that suggests a possible turnaround chance. The company's notable revenue growth and profitability, together with a low valuation, give the fundamental basis, while the technical setup near an important support level offers a possible start for a new upward price direction. This matching is exactly what the combined screening plan tries to find.
For investors wanting to find other companies that fit this specific profile of good growth and hopeful technical setups, more results can be found by using the Strong Growth Stocks with good Technical Setup Ratings screen.
Disclaimer: This article is for informational purposes only and does not constitute investment advice, a recommendation, or an offer or solicitation to buy or sell any securities. All investment involves risk, and past performance is no guarantee of future results. Investors should conduct their own research and consult with a qualified financial advisor before making any investment decisions.