
For technical investors, finding stocks that are in a solid trend and ready for their next move higher is a central method. One way to locate these chances is by looking for stocks that mix a high technical health score with a high-quality setup pattern. This method tries to find leading stocks that are pausing after gains before a possible next rise, giving a good mix of momentum and careful risk approach. A recent search using this process has pointed to COTERRA ENERGY INC (NYSE:CTRA) as a stock that deserves more attention.
Technical Health: A Base of Strength
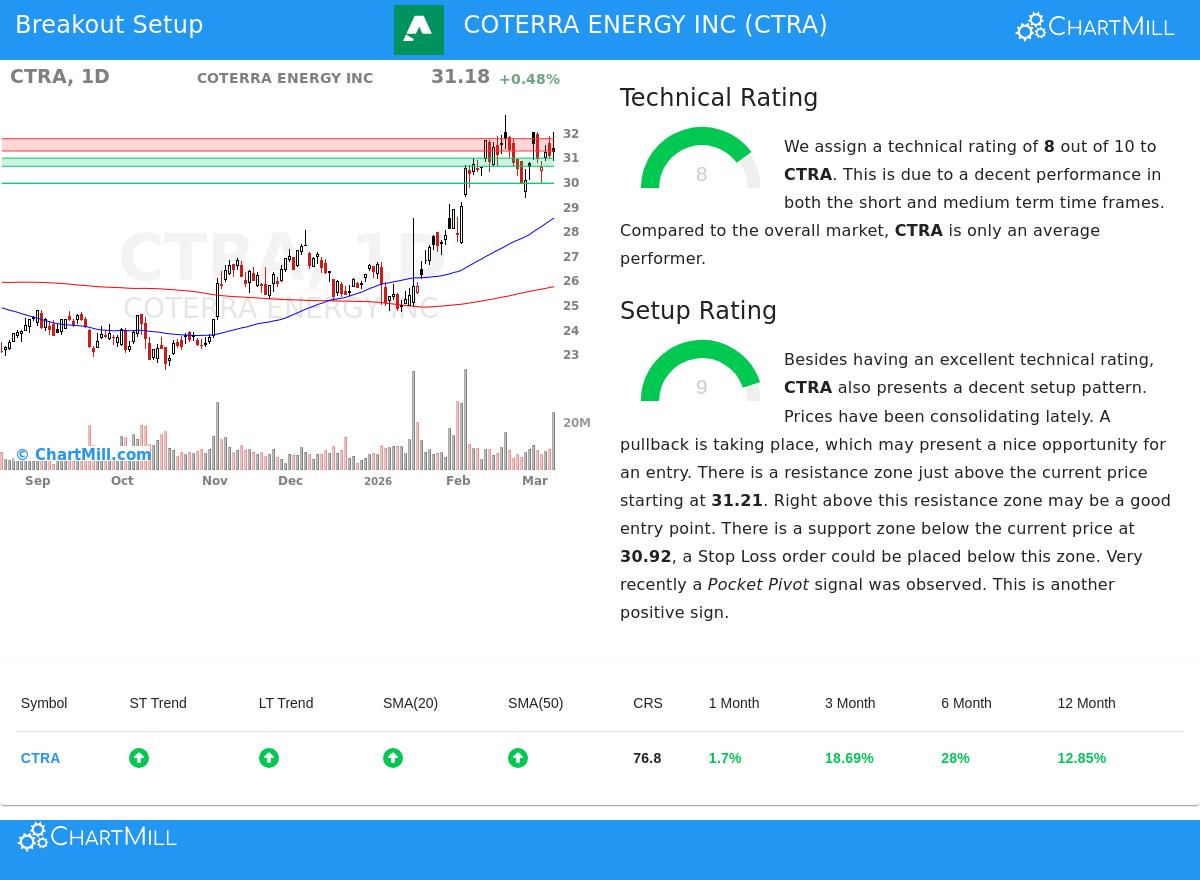
The first part of this method is a stock's basic technical health, which judges the strength and direction of its trend. According to the ChartMill Technical Analysis report, CTRA gets a solid Technical Rating of 8 out of 10. This number shows a firm base made from several important points:
- Positive Trend Agreement: Both the long-term and short-term trends for CTRA are scored as positive. This agreement across different time views points to a steady and continuing upward move, a key trait for momentum methods.
- Solid Moving Average Backing: The stock is priced above all its main simple moving averages (20, 50, 100, and 200-day), and each of these averages is itself in a rising pattern. This layered, rising support setup is a typical mark of a good uptrend.
- Good Relative Performance: CTRA is trading in the higher part of its 52-week range and has done better than about 76% of all stocks over the last year. While the wider S&P 500's long-term trend is now negative, CTRA's ability to keep positive trends and relative strength shows it is moving with its own positive momentum.
A high technical rating is important for the breakout method because it sorts for stocks that are already in a clear uptrend. The aim is not to catch a falling stock or guess a low point, but to join in the continuing move of an established trend.
Setup Quality: Finding the Entry Area
A solid trend by itself is not a sign to buy; entering at a stretched price can lead to quick declines. The second part focuses on the "when" by judging the quality of the current price pause. CTRA does well here too, having a high Setup Rating of 9. This score shows the stock is making a constructive pattern that might come before a new breakout.
- Pause Within a Band: Over the last month, CTRA has traded between about $29.32 and $32.67. It is now pausing in the middle of this band, which the analysis states "may give a good entry chance." This time of sideways movement after a rise lets the stock absorb its gains and form a new base of support.
- Clear Support and Resistance: The technical report points out a defined support area between $30.59 and $30.92, made from a mix of moving averages and trendlines. Just above the current price sits a resistance area between $31.21 and $31.71. This makes a clear plan for trade thinking: a possible breakout above resistance against a failure if support breaks.
- Helpful Volume Activity: A recent "Pocket Pivot" signal was seen, which is a volume-based sign pointing to accumulation, when price goes up on higher volume than the strongest down volume day in the earlier period. This can be a quiet mark of institutional buying during a pause stage.
The high setup rating is key because it finds times of low movement and tightening price action inside an uptrend. These pause stages often end in the direction of the main trend, giving a planned entry point with a close, sensible level to set a protective stop-loss order.
A Possible Breakout Situation
The mix of CTRA's solid technicals (rating of 8) and very good setup quality (rating of 9) puts it on watch for a technical breakout. The automated analysis proposes a specific situation where a move above the $31.72 resistance level could start an entry, with a first stop-loss set below the $30.58 support level. This states the trade's risk clearly from the start, a key part of careful technical trading. It is important to see that this is only an example made from the support and resistance levels; traders should always do their own study to decide entry, exit, and position size that fit their personal risk level.
Locating Like Chances
The process that found CTRA can be used in a regular way to find other possible breakout candidates. By focusing on stocks with both high technical and setup ratings, investors can sort the market for leaders in constructive rest stages.
You can locate more possible technical breakout setups by running the screen yourself here: Technical Breakout Setups Screen.
,
Disclaimer: This article is for information only and does not make investment advice, a suggestion, or an offer or request to buy or sell any securities. The study is based on technical data and automated scoring models. All investing and trading includes risk, including the possible loss of principal. You should do your own research and talk with a qualified money professional before making any investment choices. Past results are not a guide for future results.