
CISCO SYSTEMS INC (NASDAQ:CSCO) was identified as a Technical Breakout Setup Pattern by our stockscreener. Such a pattern occurs when we see a pause in a strong uptrend: after a strong rise the stock is consolidating a bit and at some point the trend may be continued. Whether this actually happens can not be predicted of course, but it may be a good idea to keep and eye on NASDAQ:CSCO.
What is the technical picture of CSCO telling us.
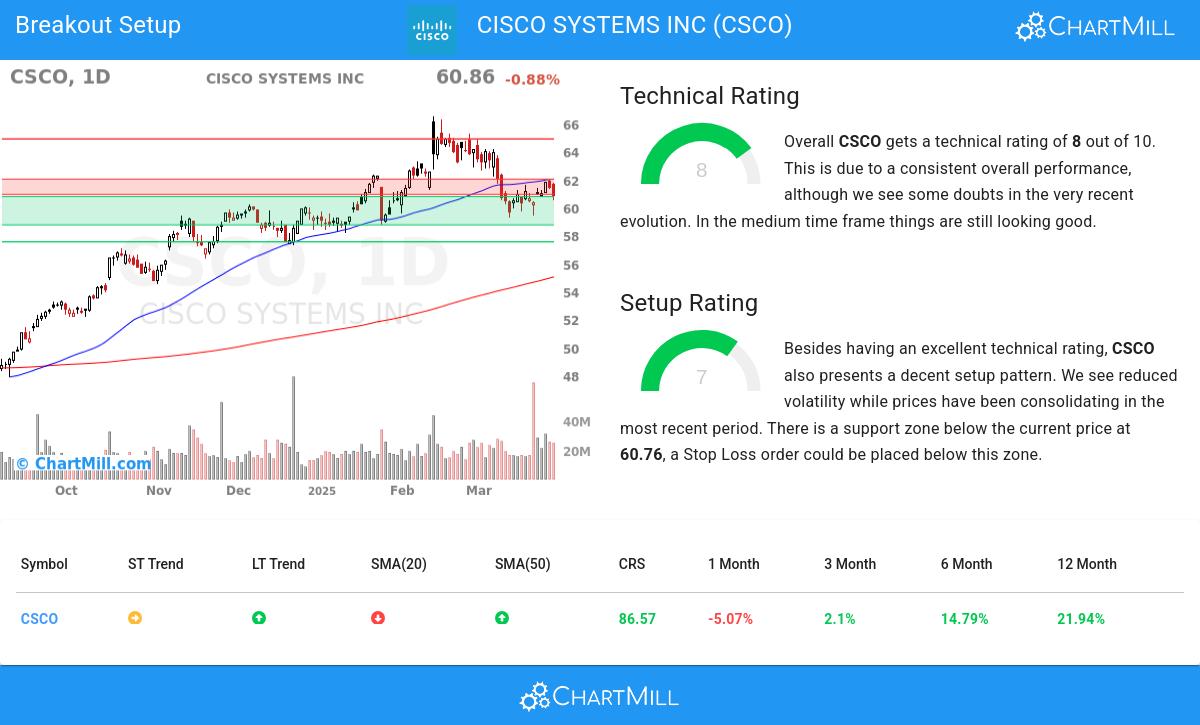
As part of its analysis, ChartMill provides a comprehensive Technical Rating for each stock. This rating, ranging from 0 to 10, is updated on a daily basis and is based on the evaluation of various technical indicators and properties.
Taking everything into account, CSCO scores 8 out of 10 in our technical rating. In the last year, CSCO was one of the better performers, but we do observe some doubts in the very recent evolution.
- The long term trend is positive and the short term trend is neutral. The long term trend gets the benefit of the doubt for now.
- When comparing the yearly performance of all stocks, we notice that CSCO is one of the better performing stocks in the market, outperforming 86% of all stocks. We also observe that the gains produced by CSCO over the past year are nicely spread over this period.
- CSCO is currently trading in the upper part of its 52 week range. The market is still in the middle of its 52 week range, so CSCO slightly outperforms the market at the moment.
- In the last month CSCO has a been trading in the 59.23 - 64.88 range, which is quite wide. It is currently trading in the middle of this range where prices have been consolidating recently, this may present a good entry opportunity, but some resistance may be present above.
- CSCO is an average performer in the Communications Equipment industry, it outperforms 66% of 49 stocks in the same industry.
For an up to date full technical analysis you can check the technical report of CSCO
Looking at the Setup
Alongside the Technical Rating, ChartMill assigns a Setup Rating to evaluate the consolidation level of a stock. This rating, ranging from 0 to 10, is updated daily and considers various short-term technical indicators. The current setup rating for CSCO is 7:
Besides having an excellent technical rating, CSCO also presents a decent setup pattern. We see reduced volatility while prices have been consolidating in the most recent period. There is a support zone below the current price at 60.76, a Stop Loss order could be placed below this zone.
Trading setups like CSCO
One way to play this would be to wait for the actual breakout to happen and buy when the stock breaks out above the current consolidation zone. A possible place for a stop loss would be below this zone.
Please note that this article should not be construed as trading advice. The information provided is solely based on automated technical analysis and serves to highlight technical observations. It is important to conduct your own analysis and make trading decisions based on your own judgment and responsibility.
Our Breakout screener lists more breakout setups and is updated daily.
Keep in mind
This article should in no way be interpreted as advice. The article is based on the observed metrics at the time of writing, but you should always make your own analysis and trade or invest at your own responsibility.


