
Our stock screener has detected a potential breakout setup on CISCO SYSTEMS INC (NASDAQ:CSCO). This breakout pattern is observed when a stock consolidates following a strong upward movement. It's important to note that this pattern is based on technical analysis, and the actual breakout outcome is uncertain. However, it might be worth keeping an eye on NASDAQ:CSCO.
Deciphering the Technical Picture of NASDAQ:CSCO
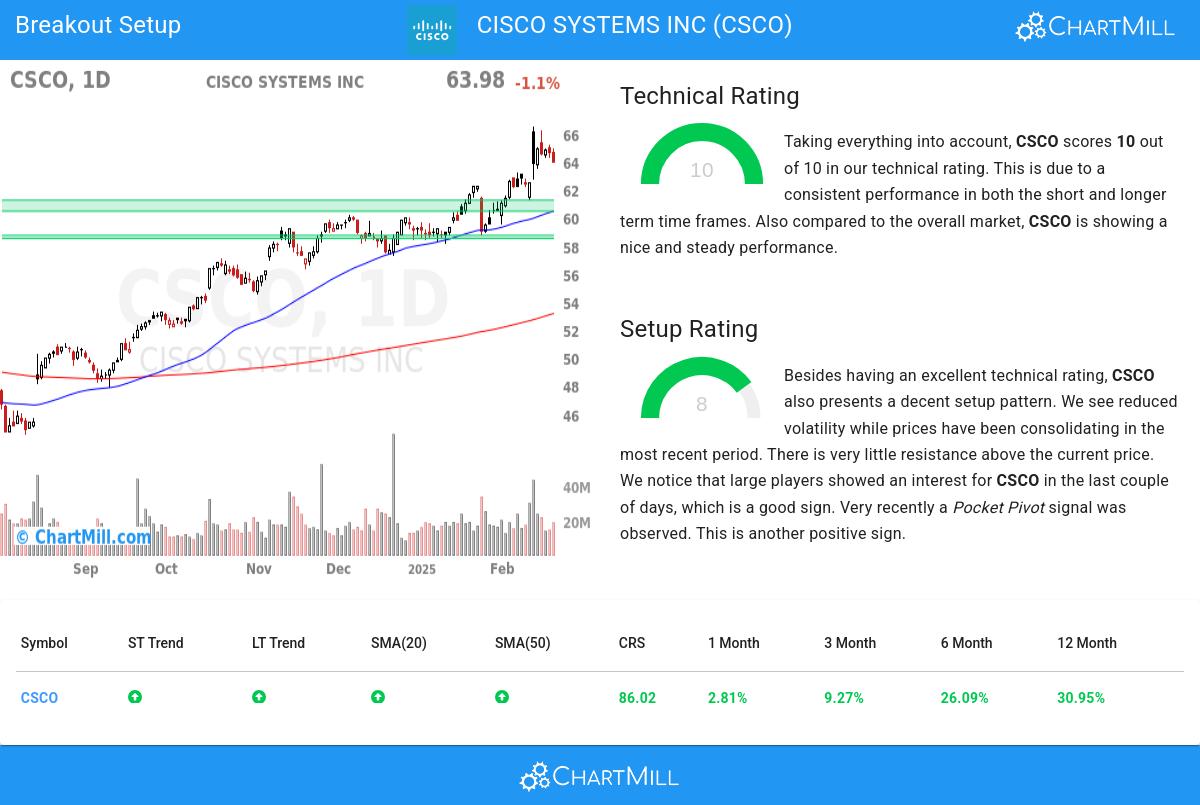
ChartMill assigns a proprietary Technical Rating to each stock. The score is computed daily by evaluating various technical indicators and properties. The score ranges from 0 to 10.
We assign a technical rating of 10 out of 10 to CSCO. Both in the recent history as in the last year, CSCO has proven to be a steady performer, scoring decent points in every aspect analyzed.
- The long and short term trends are both positive. This is looking good!
- When comparing the yearly performance of all stocks, we notice that CSCO is one of the better performing stocks in the market, outperforming 86% of all stocks. On top of that, CSCO also shows a nice and consistent pattern of rising prices.
- CSCO is currently trading near its 52 week high, which is a good sign. The S&P500 Index however is also trading near new highs, which makes the performance in line with the market.
- CSCO is currently showing a bull flag pattern! A bull flag pattern occurs when prices pull back slightly after a strong rise up. This may be a nice opportunity for an entry.
- CSCO is an average performer in the Communications Equipment industry, it outperforms 56% of 51 stocks in the same industry.
For an up to date full technical analysis you can check the technical report of CSCO
How do we evaluate the setup for NASDAQ:CSCO?
ChartMill takes into account not only the Technical Rating but also assigns a Setup Rating to each stock. This rating, on a scale of 0 to 10, reflects the degree of consolidation observed based on short-term technical indicators. Currently, NASDAQ:CSCO exhibits a 8 setup rating, indicating its consolidation status in recent days and weeks.
Besides having an excellent technical rating, CSCO also presents a decent setup pattern. Prices have been consolidating lately and the volatility has been reduced. There is very little resistance above the current price. We notice that large players showed an interest for CSCO in the last couple of days, which is a good sign. Another positive sign is the recent Pocket Pivot signal.
Trading breakout setups.
For a potential trade one would typically wait until the stock breaks out of the consolidation zone to enter the stock and it could be sold again for a loss when it would fall back below the zone.
Please note that this article should not be construed as trading advice. The information provided is solely based on automated technical analysis and serves to highlight technical observations. It is important to conduct your own analysis and make trading decisions based on your own judgment and responsibility.
Every day, new breakout setups can be found on ChartMill in our Breakout screener.
Disclaimer
This article should in no way be interpreted as advice. The article is based on the observed metrics at the time of writing, but you should always make your own analysis and trade or invest at your own responsibility.


