
Credo Technology Group Holding Ltd (NASDAQ:CRDO) stands as a notable option for investors using a high growth momentum strategy, which aims to find companies displaying both outstanding fundamental growth traits and positive technical chart formations. This approach merges the earnings momentum emphasis of methods such as CANSLIM with technical breakout patterns, focusing on stocks that show speeding up business results while also offering good entry points from a risk management viewpoint. The strategy uses ChartMill's own ratings system to measure these traits, looking for stocks with High Growth Momentum Ratings over 4, Technical Ratings over 7, and Setup Ratings over 7 to confirm both fundamental soundness and technical timing agreement.
Fundamental Growth Momentum
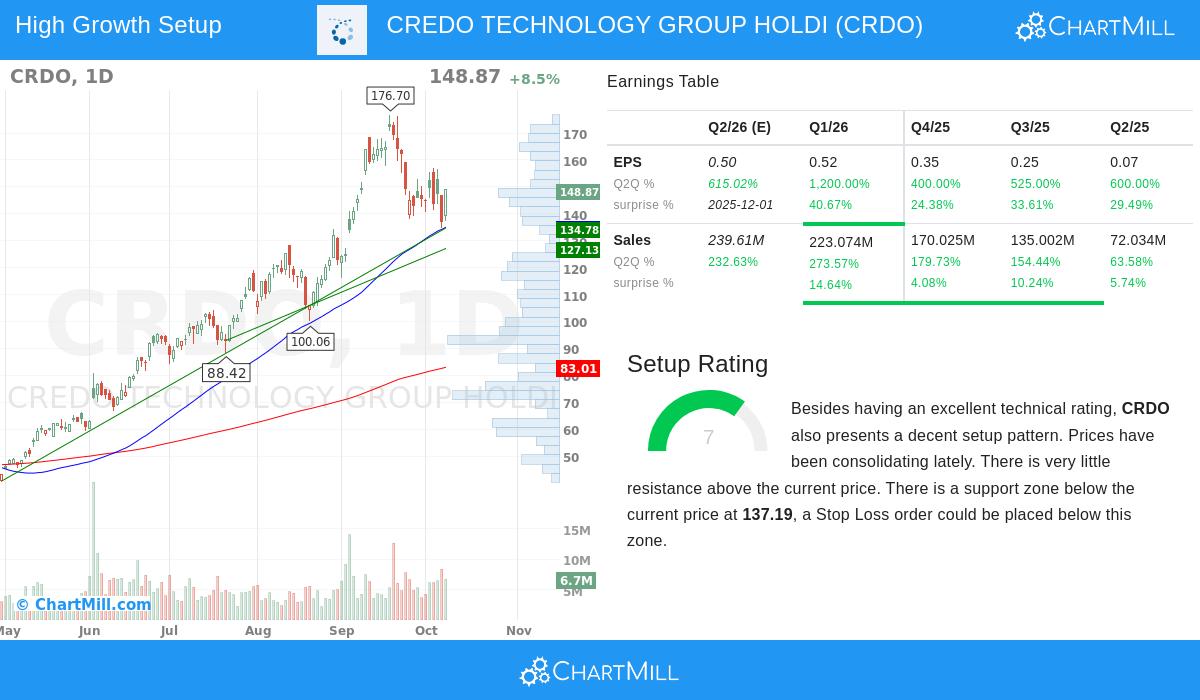
CRDO's strong fundamental results place it well inside the high growth momentum model, reaching a High Growth Momentum Rating of 8 out of 10. The company shows notable speeding up in important financial measures that are vital to growth investing methods.
- Strong Earnings Growth: The company has reported very good year-over-year EPS growth in recent quarters, with the latest quarter displaying 1200% growth versus the same quarter last year. Earlier quarters continued this high momentum with growth figures of 400%, 525%, and 600% in order.
- Revenue Speeding Up: Sales growth has shown steady speeding up, rising from 63.6% year-over-year growth three quarters ago to 273.6% in the most recent quarter. This sequence of speeding up revenue growth is a main trait looked for by momentum investors.
- Profit Margin Improvement: The company's profit margin has improved noticeably, getting to 28.4% in the most recent quarter compared to 21.5% in the quarter before, showing better operational effectiveness along with fast growth.
- Analyst Belief: Wall Street has reacted to this solid performance with positive changes, raising next year's EPS projections by 35.3% and revenue projections by 19.8% over the last three months.
- Reliable Performance: CRDO has surpassed EPS projections in all of the last four quarters by an average of 32%, while also beating revenue projections in every quarter by an average of 8.7%.
Technical Soundness and Setup Condition
From a technical viewpoint, CRDO offers a notable case with a Technical Rating of 9 out of 10 and a Setup Rating of 7 out of 10. The detailed technical analysis shows several positive points that match with breakout trading methods.
The stock shows very good relative strength, performing better than 97% of all stocks over the last year and placing in the top 6% of its semiconductor industry group. This leading trait is basic to momentum investing methods. The long-term trend stays clearly positive across several time periods, with the stock trading well above its important moving averages, located at $148.87 compared to the 50-day SMA of $135.03 and 200-day SMA of $83.01.
At present, the stock is creating a consolidation formation inside the $134.80 to $176.70 band, trading close to the lower part of this band. This consolidation offers a possible setup chance with clearly marked support and resistance points. The technical analysis finds important support between $134.78 and $137.19, created by a mix of trend lines and moving averages, while resistance is at $149.64.
Risk Management Points
The current technical setup provides well-marked risk factors for possible entry. The analysis indicates a possible entry above the $149.64 resistance point with a stop loss placed below the support area at $134.79. This makes a specific risk of about 9.9% from entry to stop loss, allowing for exact position sizing based on personal risk tolerance.
Traders should be aware that while the stock has shown very good momentum, it currently trades in the higher part of its 52-week band but is somewhat behind the wider market, which is trading close to new highs. The recent one-month performance shows a drop of 9.2%, possibly representing a normal pullback within the frame of the stock's 289% twelve-month increase.
For investors looking for comparable high-growth momentum stocks with good technical setups, more options can be found using the High Growth Momentum Breakout Setups screen, which methodically finds stocks meeting these particular requirements.
Disclaimer: This article is for informational purposes only and does not constitute investment advice, recommendation, or endorsement of any security. The information presented should not be used as the sole basis for making investment decisions. Investors should conduct their own research and consult with a qualified financial advisor before making any investment decisions. Past performance is not indicative of future results, and all investments carry risk, including the possible loss of principal.