
Growth investors are looking for stocks showing high revenue and EPS growth. We will have a look here to see if MR COOPER GROUP INC (NASDAQ:COOP) is suited for growth investing. Investors should of course do their own research, but we spotted MR COOPER GROUP INC showing up in our Minervini growth screen, so it may be worth spending some more time on it.
COOP passes the Minervini Trend Template check!
The Minervini Trend Template is a set of technical criteria designed to identify stocks in strong uptrends. We can check all the boxes for COOP:
- ✔ Relative Strength is above 70.
- ✔ Current price is within 25% of it's 52-week high.
- ✔ Current price is at least 30% above it's 52-week low.
- ✔ The current price is above the 50-, 150- and 200-day SMA price line.
- ✔ The SMA(200) is trending upwards.
- ✔ The SMA(150) is above the SMA(200)
- ✔ The SMA(50) is above the SMA(150) and the SMA(200)
Looking into the high growth metrics of COOP
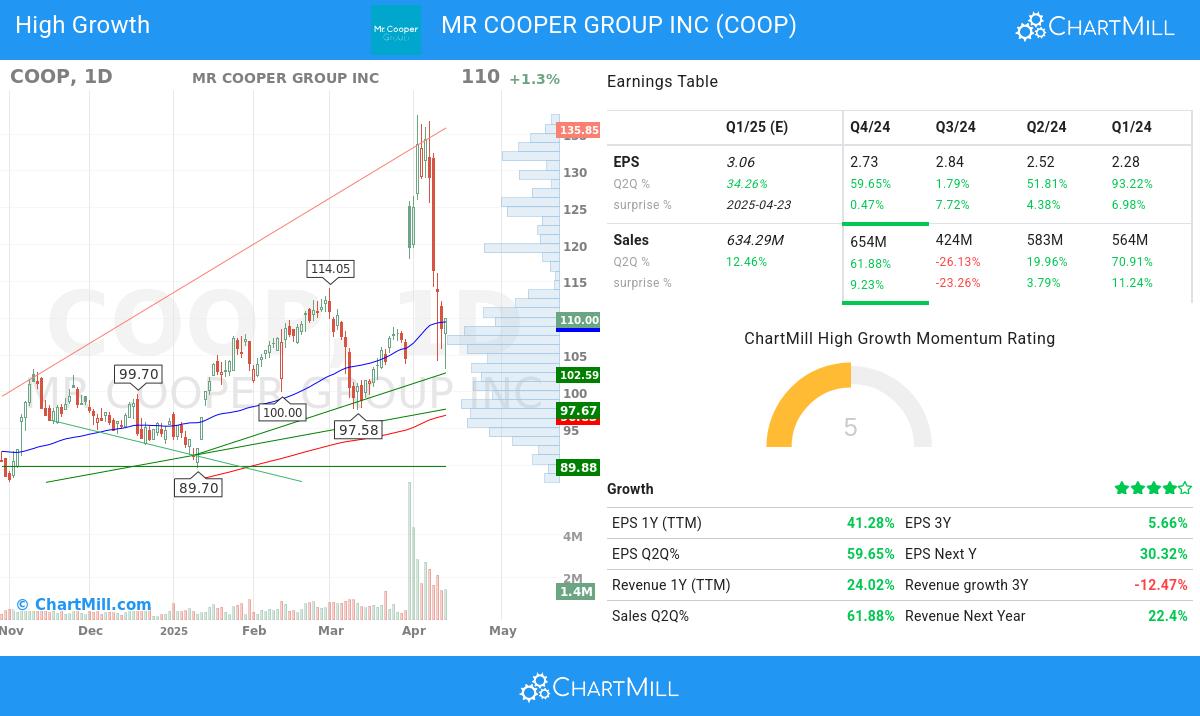
ChartMill assigns a High Growth Momentum Rating (HGM) to every stock. This score ranges from 0 to 10 and evaluates the different growth and profitability aspects, including accelleration, surprises and revisions. COOP scores a 5 out of 10:
Explosive Earnings Growth
- The quarterly earnings of COOP have shown a 59.65% increase compared to the previous quarter, as revealed in the recent financial report. This growth signifies positive momentum in the company's financials, pointing towards a promising upward trend
- COOP shows accelerating EPS growth: when comparing the current Q2Q growth of 59.65% to the previous quarter Q2Q growth of 1.79%, we see the growth rate improving.
- Over the past year, COOP has demonstrated 41.28% growth in EPS, signifying its positive financial trajectory and potential for future profitability.
- COOP has demonstrated strong q2q revenue growth of 61.88%, suggesting a favorable trend in the company's financials and indicating the potential for continued expansion.
- Accelerating Sales growth for COOP: the current Q2Q growth of 61.88% exceeds the previous quarter Q2Q growth of -26.13%.
- With notable 1-year revenue growth of 24.02%, COOP exemplifies its ability to generate increased sales and revenue streams. This growth signifies the company's strong business performance and its potential for future growth.
- COOP has a strong history of beating EPS estimates in the last 4 quarters, signaling its ability to consistently exceed market expectations. This indicates the company's strong financial performance and its potential for creating shareholder value.
Profitability & Financial Strength
- With a favorable trend in its operating margin over the past year, COOP demonstrates its ability to enhance profitability through efficient operations. This growth reflects the company's focus on optimizing its cost structure.
- The profit margin of COOP has seen steady growth over the past year, signaling improved profitability.
- COOP showcases a robust Return on Equity (ROE) of 13.9%, indicating its ability to generate favorable returns for shareholders. This metric underscores the company's efficiency in utilizing its equity capital to generate profits.
Institutional Confidence & Market Strength
- With 90.32% of the total shares held by institutional investors, COOP showcases a healthy distribution of ownership. This suggests a mix of institutional and retail investors, fostering a dynamic market for the stock.
- The Relative Strength (RS) of COOP has been consistently solid, with a current 95.23 rating. This highlights the stock's ability to exhibit sustained price strength and signifies its competitive advantage.
Why is COOP a setup?
ChartMill also assign a Setup Rating to every stock. With this score it is determined to what extend the stock has been trading in a range in the recent days and weeks. This score also ranges from 0 to 10 and is updated daily. The setup score evaluates various short term technical indicators. COOP scores a 3 out of 10:
Although COOP has an excellent technical rating, it does not present a decent entry opportunity at the moment. Price movement has been a little bit too volatile to find a nice entry and exit point. It is probably a good idea to wait for a consolidation first.
For an up to date full technical analysis you can check the technical report of COOP
More like this
Our High Growth Momentum + Trend Template screen will find you more ideas which meet the Minervini criteria.
Keep in mind
This is not investing advice! The article highlights some of the observations at the time of writing, but you should always make your own analysis and invest based on your own insights.