
For investors who use charts and price action to make choices, the search for promising opportunities often comes down to two key questions: which stock is in a strong trend, and when is the right time to buy it? A methodical way to answer these questions involves looking for stocks that show both good technical health and a clear, low-risk entry pattern. This process centers on finding securities that are not only in clear uptrends but are also moving sideways in a tight band, preparing for a possible breakout.
One stock currently appearing on these technical scans is The Cooper Cos Inc (NASDAQ:COO), a medical device company with important positions in contact lenses and women's healthcare. The company's recent price action indicates it may be getting ready for its next important move.
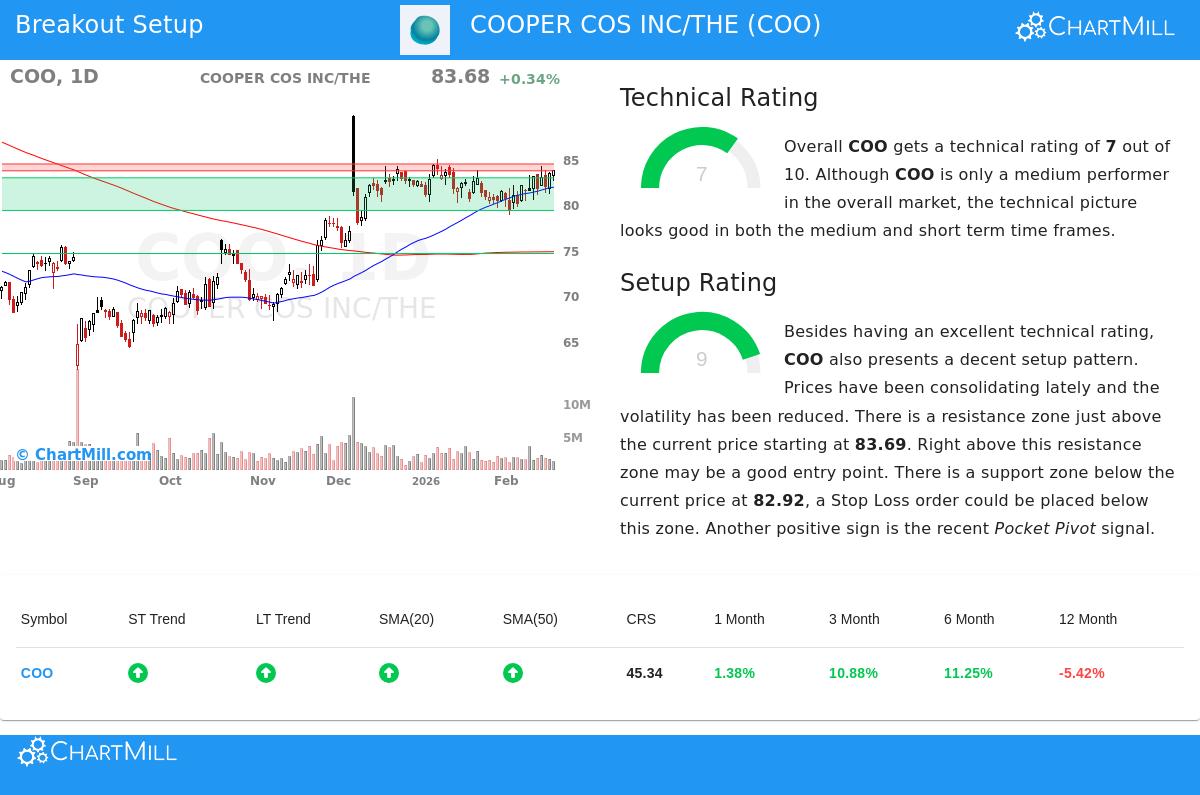
Looking at the Technical Base
The first part of this plan is checking the stock's basic technical strength. A high technical score shows a stock is in a good uptrend, doing better than similar companies, and trading above important moving averages, all signs of continued buying interest. For COO, the ChartMill Technical Report gives a good score of 7 out of 10, pointing to a positive technical setting.
Important parts of this score include:
- Positive Trend Agreement: Both the long-term and short-term trends for COO are scored as positive. This agreement across different time periods is a standard feature of a good uptrend, meaning the stock's momentum is likely more than a temporary rise.
- Good Industry Position: Inside the competitive Health Care Equipment & Supplies sector, COO shows relative strength, doing better than 70% of its 185 industry peers. This shows the stock's strength is specific to the company and not just a result of overall sector movement.
- Helpful Moving Averages: The stock is trading above its key simple moving averages (20, 50, 100, and 200-day), and all these averages are moving upward. This ordered, rising arrangement of moving averages often works as a changing support structure.
This base of technical strength is important because it raises the chance that any breakout from a sideways pattern will keep going in the direction of the main trend, instead of stalling or turning down.
Judging the Setup Condition
A strong trend by itself is not a buy signal; entering a stock that has already made a big, extended move can be risky. The second important question, when to buy, is answered by judging the condition of the current price setup. A high setup score indicates a time of sideways movement, where volatility lessens and the stock forms a base, giving a clear point for entry and a close point for a protective stop-loss. COO does very well here, getting a setup score of 9.
The current chart pattern shows why:
- Sideways Movement in a Band: Over the last month, COO has been trading between about $78.79 and $84.23. This time of sideways action after a previous rise lets the stock reduce overbought conditions and build energy for its next move higher.
- Specific Support and Resistance: The analysis finds a clear support area between $79.33 and $82.92, made by a combination of trendlines and moving averages. Just above the current price is a set resistance area between $83.69 and $84.44. This creates a clear point of conflict; a strong move above resistance could mark the beginning of a new uptrend stage.
- Helpful Volume Sign: A recent "Pocket Pivot" sign has been noted, which is a volume-based signal pointing to buying by larger investors during the sideways phase. This can sometimes come before a breakout.
This high-condition setup is what technical investors seek, as it gives a reasoned and structured plan for trade management: enter on a breakout above resistance, with a stop-loss set below the nearby support area.
A Possible Trade Plan
From this analysis, a specific trading idea appears. The technical report points to an entry point just above the resistance area at $84.45, which would confirm a breakout from the recent sideways movement. A stop-loss order could be set at $79.75, just below the found support, setting the trade's risk at about 5.6%. For a portfolio risking 1% on the trade, this means a capital commitment of about 18%.
It is important to remember this is only a technical, pattern-based example. Investors need to think about basic factors, like the company's next earnings report on May 30th, which can create large price swings separate from chart patterns. Also, while COO's trends are positive, its results over the last year have been ordinary compared to the wider market, showing it is following a trend rather than setting it in the current cycle.
Locating Comparable Chances
The mix of a good technical score (7) and a very high setup score (9) is what put COO on the list for this breakout scan. For investors wanting to find other stocks currently showing similar technical patterns, new choices are found each day through the Technical Breakout Setups screen.
Disclaimer: This article is for information only and is not investment advice, a suggestion, or an offer to buy or sell any security. The analysis uses technical data and automated scoring models. All trading and investment choices have risk, including the possible loss of principal. Investors should do their own research and talk with a qualified financial advisor before making any investment choices. Past results do not guarantee future outcomes.