
For investors who use charts and price action to guide their choices, a methodical way to find possible trades is important. One such technique looks for stocks that are both technically sound and building a favorable price formation, a pairing that can point to a likely breakout chance. This method centers on two main proprietary measures from ChartMill: the Technical Rating, which judges the general condition and direction of a stock, and the Setup Quality Rating, which examines if the stock's present price action shows a distinct and manageable entry point. By sorting for securities that rank well on both counts, technical traders try to find leading stocks that are resting before their next possible rise.
CME Group Inc (NASDAQ:CME) recently appeared from such a scan, showing a profile that deserves more attention from a technical standpoint. As the operator of one of the world's major derivatives marketplaces, its business foundations are linked to global trading activity. However, from a chart-based perspective, its recent price movement and technical scores indicate it may be arranging for a notable move.
Examining the Technical Base
The basis of this breakout method is first confirming a stock is in a good technical state, as measured by ChartMill’s Technical Rating. A high score means a stock is in a definite uptrend, displaying better performance compared to the wider market, and is trading well relative to important moving averages. This supplies the needed support for a breakout try to work.
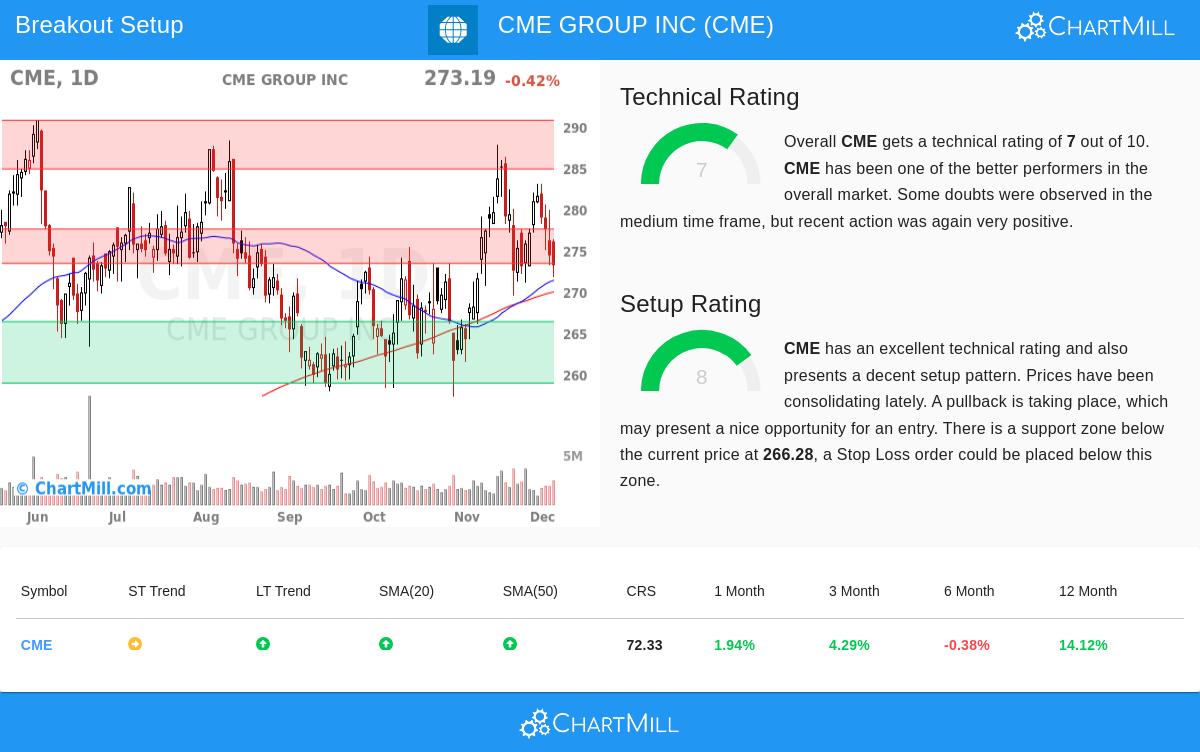
CME’s present Technical Rating of 7 out of 10 puts it in good standing. The full technical report lists several positive factors:
- Trend Direction: The long-term trend is labeled as positive, which is the main base for a bullish setup. While the short-term trend is seen as neutral, this frequently aligns with the pause period the method looks for.
- Market and Sector Performance: The stock has done better than 72% of the total market and 81% of its peers in the Capital Markets industry over the last year, showing clear comparative strength.
- Price Level: CME is trading in the higher part of its 52-week range and above its key long-term moving averages (the 50-day and 200-day SMAs), confirming the bullish framework.
This mix of a positive long-term trend, leading status, and favorable price level satisfies the initial "which stock?" requirement of the method, marking CME as a technically healthy candidate.
Judging the Setup Quality
A solid trend by itself is not a buy signal; entering at a poor moment can result in quick losses. This is where the Setup Quality Rating becomes important. It addresses the "when?" by finding periods of price compression, times when a stock trades in a limited band, volatility lessens, and support levels are formed. A high score implies the stock is tightening, possibly getting ready for a directional breakout.
CME receives a Setup Rating of 8, meaning a favorable compression formation. The analysis notes a decline within a set trading band, which can give a planned entry chance. Main parts of this setup are:
- Set Trading Band: Over the last month, the stock has moved between about $266 and $288, and it is now trading in the center of this band after a recent decline.
- Clear Support Area: An important support zone is seen between $258.82 and $266.28, made by the meeting of several trendlines. This gives a sensible level below which a long trade would fail, allowing for exact risk control.
- Nearness to Resistance: The stock meets close resistance in the $273.36 to $277.52 area. A clear move above this barrier could show the restart of the main uptrend and start the suggested breakout entry.
The existence of this narrow compression near the highs, with clear support below, is precisely the kind of formation the scanning process is made to find. It implies that while the long-term momentum remains, the stock is pausing, possibly preparing for its next climb.
A Possible Trade Plan
Based on this technical and setup examination, ChartMill’s report describes an example trading plan. It proposes an entry on a breakout above the resistance area at $277.53, with a protective stop loss set just below the nearby support at $271.03. This establishes a risk of about 2.3% on the trade itself. It is essential to state that this is an automated example; careful traders should always modify such details to match their personal risk comfort and verify the levels on the live chart.
Find More Possible Setups The market is active, and new technical formations appear often. Investors curious about using this process to find other chances can view the current list of matching stocks through the Technical Breakout Setups screen.
Disclaimer: This article is for information only and does not form investment advice, a suggestion, or an offer or request to buy or sell any securities. The examination is based on technical measures and past price data, which are not assurances of future results. Investing carries risk, including the possible loss of principal. Always do your own research and think about your financial position and risk comfort before making any investment choices. The example trade plan noted is automated and for illustration; you are fully responsible for any investment decisions you make.