
For investors looking for a systematic way to find leading companies with high growth, the CANSLIM method is a foundational strategy. Created by William O'Neil, this approach mixes detailed fundamental review with important technical signals to find stocks with possible major price gains. The letters represent Current quarterly earnings, Annual earnings increases, New products/highs, Supply and demand, Leaders, Institutional sponsorship, and Market direction. The aim is to locate firms showing powerful profit growth that are also being noted and bought by major investors, all while the general market trend is positive.
A recent filter using these ideas has highlighted CELESTICA INC (NYSE:CLS) as a stock for further review. The Toronto-based supply chain solutions company seems to fit a number of central parts of the CANSLIM method, showing a notable mix of financial health and price movement.
Reviewing the Fundamental Parts: C, A, and S
The "C" and "A" in CANSLIM require solid and speeding earnings. Celestica meets this with notable growth numbers that go beyond the strategy's usual limits.
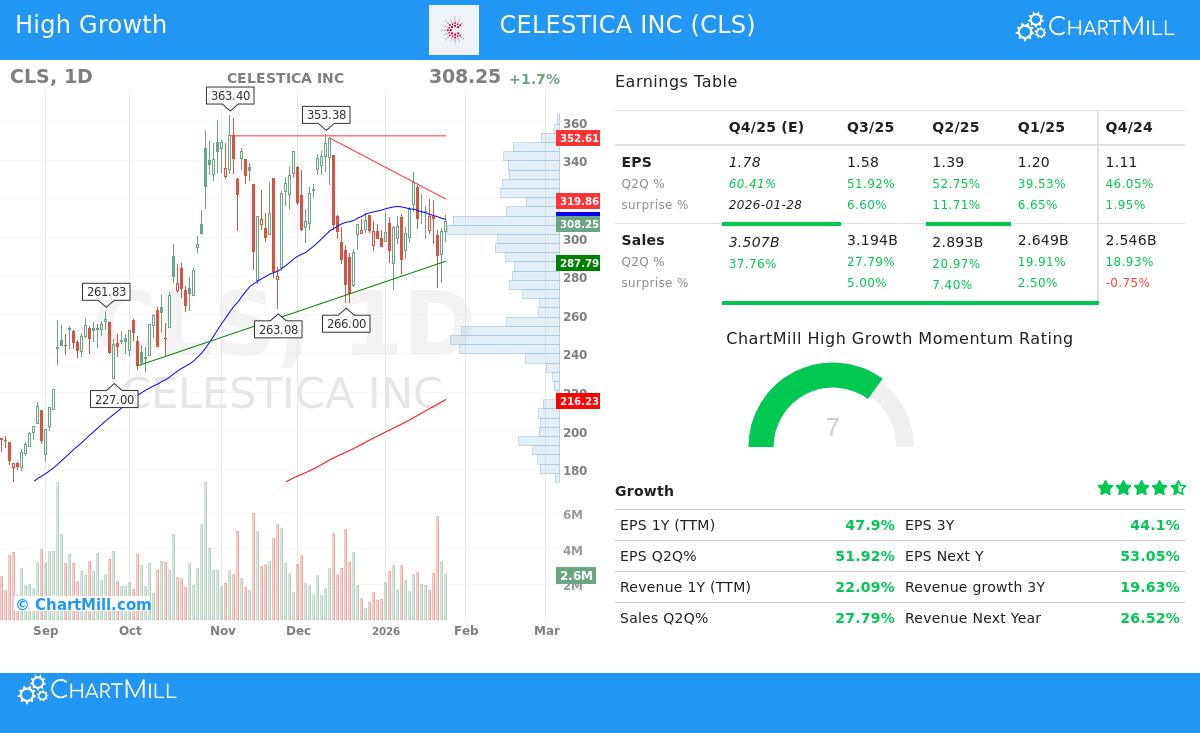
- Current Quarterly Earnings (C): The firm reported a year-over-year EPS growth of 51.9% for its latest quarter, greatly exceeding the common minimum filter of 20-25%. This shows strong, recent profit movement.
- Annual Earnings Increases (A): Viewing a longer period, Celestica's 3-year EPS compound annual growth rate (CAGR) is 44.1%, showing a continued record of high growth that is faster than the 25-50% range O'Neil notes.
- Supply and Demand (S): A main financial health number in the system is the Debt-to-Equity ratio. Celestica has a low 0.37, much under the filter's limit of 2, indicating a healthy balance sheet without heavy debt. This financial steadiness aids future growth plans.
These numbers are not separate facts but show a wider fundamental view. According to ChartMill's fundamental analysis report, CLS gets a good score of 7 out of 10, with special force in profitability. The company has an outstanding Return on Equity (ROE) of 35.3%, a key "A" requirement that puts it in the best group of its industry. The growth score is higher at 9 out of 10, backed by solid past revenue growth and positive future projections.
Technical and Market Position: N, L, and I
CANSLIM is not only a fundamental strategy; it needs confirmation from the market. This is where the technical and qualitative requirements matter.
- New Highs & Leadership (N & L): The strategy prefers stocks showing better strength and position. Celestica's technical picture supports this, with a Relative Strength (CRS) score of 94.71. This means the stock has done better than almost 95% of the market over the past year, a clear mark of position. While the stock has moved down from its highest points lately, its longer-term direction is still up, and it trades in the higher part of its 52-week range.
- Institutional Sponsorship (I): Institutional ownership has two sides; you want support but not too much. Celestica's institutional ownership is 73.7%, below the 85% top limit often used in filters. This points to major institutional attention while allowing for more buying, which can give continued upward pressure.
The technical analysis report for CLS gives a score of 6 out of 10. It states that while the near-term direction has become neutral, the longer-term direction is still positive. The report also points out a reasonable price pattern, with prices holding in a range and lower price swings, which can at times come before a new directional change.
The Last Part: Market Direction (M)
The "M" in CANSLIM is an important note that even the best single stock can have difficulty in a poor overall market. The strategy suggests looking for entry points mainly during clear rising markets. At this time, the S&P 500 keeps a positive longer-term and near-term direction, giving a good setting for reviewing growth-focused ideas like Celestica. This matches the system's instruction to follow the general market's direction.
Outline and Filtering Background
In outline, CELESTICA INC shows a profile that meets several CANSLIM filters:
- Powerful Earnings Growth: Strong quarterly (51.9%) and annual (44.1% CAGR) EPS growth.
- High Profitability: Outstanding ROE of 35.3% and a good fundamental score.
- Financial Health: A low Debt-to-Equity ratio of 0.37.
- Market Notice: High relative strength (94.71) and large but not too high institutional ownership (73.7%).
- Good Market: A positive general market direction gives a fitting setting.
It is key to see this stock within the filtering process that found it. The CANSLIM filter is made to sort a huge number of stocks down to a short list of choices that meet firm growth, financial, and movement requirements. Celestica passed this multi-part test.
Interested in reviewing other stocks that currently pass similar CANSLIM-based growth filters? You can run the filter yourself and see the newest results here.
Disclaimer: This article is for information and learning only. It is not meant as investment guidance, a suggestion, or an offer or request to buy or sell any securities. The review of CELESTICA INC (CLS) is based on data and a specific investment method (CANSLIM) at a point in time; past results do not show future outcomes. Investors should do their own complete research, think about their financial position, risk comfort, and investment goals, and talk with a qualified financial advisor before making any investment choices.