
Investors looking to find high-growth market leaders have long used the CAN SLIM method, a system made popular by William O'Neil. This approach joins strict fundamental study with important technical signs to find stocks with solid earnings momentum, institutional support, and better relative strength, all while considering a good market setting. The aim is to locate companies not only with solid past results, but with the drivers and market acceptance to point to ongoing upward price action.
A recent filter using this method has pointed to Celestica Inc (NYSE:CLS) as a stock deserving more study. The Toronto-based company providing supply chain solutions seems to fit many central CAN SLIM points, offering a notable profile for investors focused on growth.
Reviewing the Fundamental "CAN SLIM" Match
The name CAN SLIM lists specific fundamental and technical points to check. Celestica's present financial numbers show a match with the first several parts of this structure.
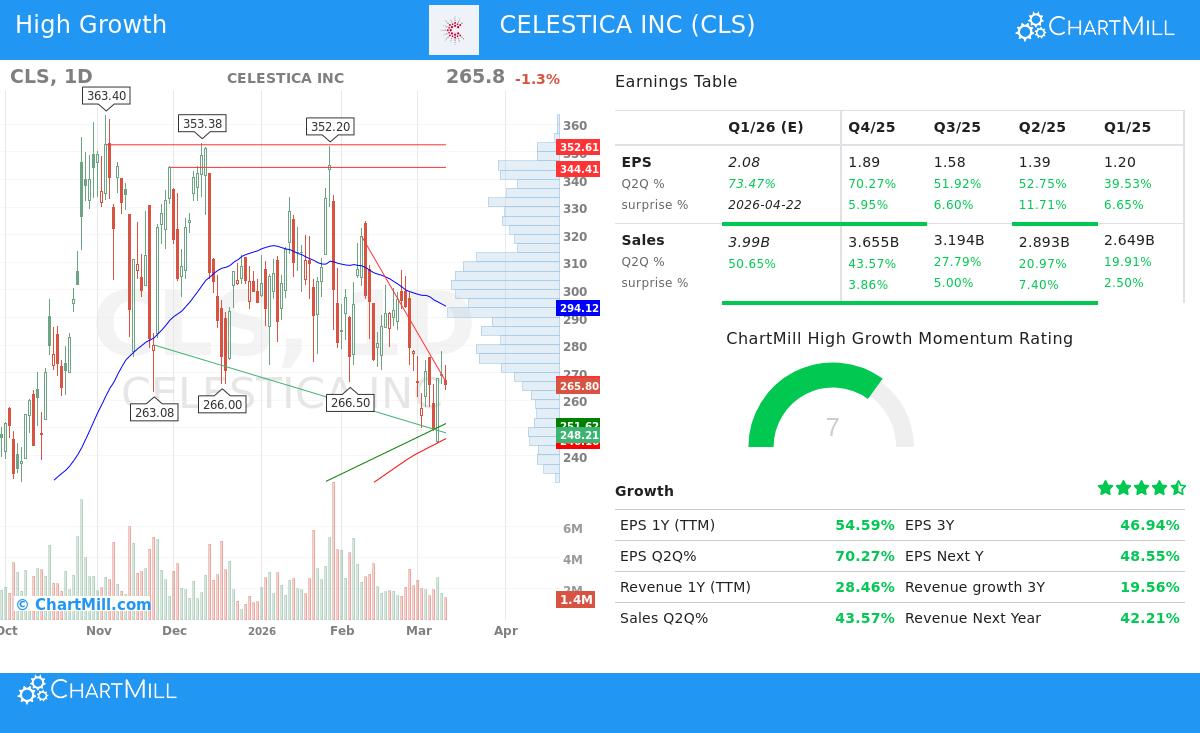
- C - Current Quarterly Earnings & Sales: The method requires large or speeding quarterly growth. Celestica states a very high 70.3% year-over-year earnings per share (EPS) growth and a solid 43.6% sales growth for its latest quarter, well past the usual lowest points of 20-25%. This fast momentum is a main filter for CAN SLIM filters.
- A - Annual Earnings Increases: Investors need to search for steady, large yearly growth. Celestica displays a good history here too, with a 3-year EPS compound annual growth rate (CAGR) near 46.9%. This shows the company's recent quarterly jump is part of a maintained, multi-year pattern of profit growth, not a single occurrence.
- N - New Products, New Highs: While based on quality, Celestica works in the high-need fields of Advanced Technology Solutions and Connectivity & Cloud Solutions, including parts like aerospace, health tech, and servers. This places the company where several lasting technology trends meet. From a technical view, the "new highs" part is met by its very good relative strength.
- L - Leader or Laggard: This is a key part of the system, stating that the best fundamentals matter little if the market does not acknowledge them. Celestica does very well here, having a ChartMill Relative Strength (CRS) score of 96. This means its price action over the past year has done better than 96% of all stocks, clearly naming it a market leader, a required feature for CAN SLIM stocks.
- I - Institutional Sponsorship: The method looks for stocks with rising institutional attention but where ownership is not so large that all possible buying is done. Celestica's institutional ownership is near 73%, which is under the 85% limit often used in filters. This indicates there is still space for more institutional buying, which can give important upward price force.
Financial Condition and Valuation Setting
A closer look at Celestica's fundamental profile shows a company in good financial condition, which backs its growth story. The company's Return on Equity (ROE) of 37.6% is very high, showing very efficient use of shareholder money. Its debt-to-equity ratio of 0.34 shows a careful balance sheet, matching the CAN SLIM liking for companies with workable debt (often filtered for a ratio under 2).
Yet, growth at this speed and quality often has a cost. Celestica's present valuation, with a P/E ratio over 43, is clearly high on a plain basis. The company's fundamental report states that while the stock seems costly on standard measures, this might be partly reasoned by its very high profitability and a large expected future earnings growth rate over 40%. The main point for CAN SLIM investors is if the price momentum can keep supporting the high price.
Technical View and Market Factors
The technical study shows a varied but interesting view. On one side, Celestica's long-term trend is neutral, and its short-term trend is negative, having moved down from its 52-week highs. The stock is now trading between noted support near $250 and resistance around $266, settling inside its recent range.
On the other side, the settling has formed what analysts call a "good setup pattern," with lower volatility and price action staying above a main support area. Importantly, the technical report notes recent attention from large investors, as measured by the Effective Volume indicator. For CAN SLIM investors, such a setup after a large upward move could show a possible entry point during a time of pause, if the overall market direction is helpful.
This brings the last letter: M - Market Direction. The CAN SLIM method stresses that even the strongest single stock can have difficulty in a poor wider market. At present, the long-term trend for the S&P 500 is negative, with a neutral short-term trend. This setting needs increased care and choice, highlighting the importance of exact entry points and strict risk control, which are key parts of the method.
Summary and Next Steps
In summary, Celestica Inc. makes a good argument for CAN SLIM method users. It meets the central fundamental needs of fast quarterly and yearly earnings growth, pairs it with better market-leading relative strength, and keeps good institutional sponsorship and balance sheet measures. The main tests are its high valuation and the present unclear wider market trend, which highlights the need for careful technical timing.
Investors wanting to do their own study can see the full Fundamental Analysis and Technical Analysis reports for CLS.
For those looking to find other companies that fit this growth-centered model, you can view the set O'Neill CANSLIM High Growth screen to see the present list of matching stocks.
,
Disclaimer: This article is for information only and is not investment advice, a suggestion, or a deal to buy or sell any security. The CAN SLIM method includes risk, and past results do not show future outcomes. Investors should do their own study and think about their money situation, risk comfort, and investment goals before making any investment choice.