
For investors looking to join solid fundamental growth with positive technical patterns, a layered screening method can be especially useful. One such technique focuses on finding securities that show high earnings momentum, are in a clear uptrend, and are also forming into a possible breakout pattern. This plan depends on three specific ChartMill ratings: a High Growth Momentum (HGM) Rating over 4 to find improving fundamental performance, a Technical Rating over 7 to verify the stock is in a good uptrend, and a Setup Rating over 7 to find times of helpful price consolidation. CELESTICA INC (NYSE:CLS) appears as a present candidate fitting this joined standard, offering a case study in matching growth and technical timing.
Fundamental Growth Momentum
Celestica's attraction for momentum investors is based in its solid and quickening financial results, as seen in its HGM Rating of 7. The company shows force across several main growth measures the rating assesses.
- Earnings and Sales Quickening: The company is not only growing, but the speed of growth is rising in the short term. Quarterly earnings per share (EPS) growth year-over-year has quickened from 39.5% two quarters ago to 51.9% in the latest quarter. Sales growth displays a similar trend, changing from 18.9% to 27.8% in that time. This quickening is a vital part of the HGM Rating, indicating widening business momentum.
- Solid Year-Over-Year Growth: On a trailing twelve-month (TTM) basis, EPS has increased by 47.9%, while revenue is higher by 22.1%. This firm base growth is joined by even more forceful full-year numbers, with EPS jumping 61.3% in the last reported fiscal year.
- Margin Growth and Estimate Changes: Profit margins are growing notably, with the last quarter's margin at 8.38%, up from 3.25% two quarters before. This operational gain is being noted by analysts, who have changed their next-year EPS estimates higher by over 8% in the past three months, another good element in the HGM score.
- Steady Performance: Celestica has surpassed EPS estimates in each of the past four quarters, with an average beat of 6.7%. This record of exceeding forecasts creates trust for future estimates.
This mix of quickening, solid total growth, growing profitability, and positive analyst view forms the fundamental argument for why CLS achieves a good score on the High Growth Momentum Rating, marking it as a company with strong short-term earnings force.
Technical Condition and Trend Force
While good fundamentals give the "why" to look at a stock, technical analysis aids with the "when." According to the detailed ChartMill Technical Report, CLS has a Technical Rating of 8, showing very good technical foundations. The report summary states that CLS "was one of the better performers" in the past year.
Main technical positives supporting this rating include:
- A good long-term trend, with the stock price well above its rising 100-day and 200-day simple moving averages.
- Outstanding relative force, doing better than 96% of all stocks in the past year and placed in the top group of its industry.
- The stock is trading in the higher part of its 52-week range, which went from $58.05 to $363.40, showing a major and continued upward move.
This high Technical Rating is needed for the plan because it confirms the stock is already in a clear uptrend and showing market strength, raising the chance that a fundamental breakout will be followed by price action.
High-Grade Setup Pattern
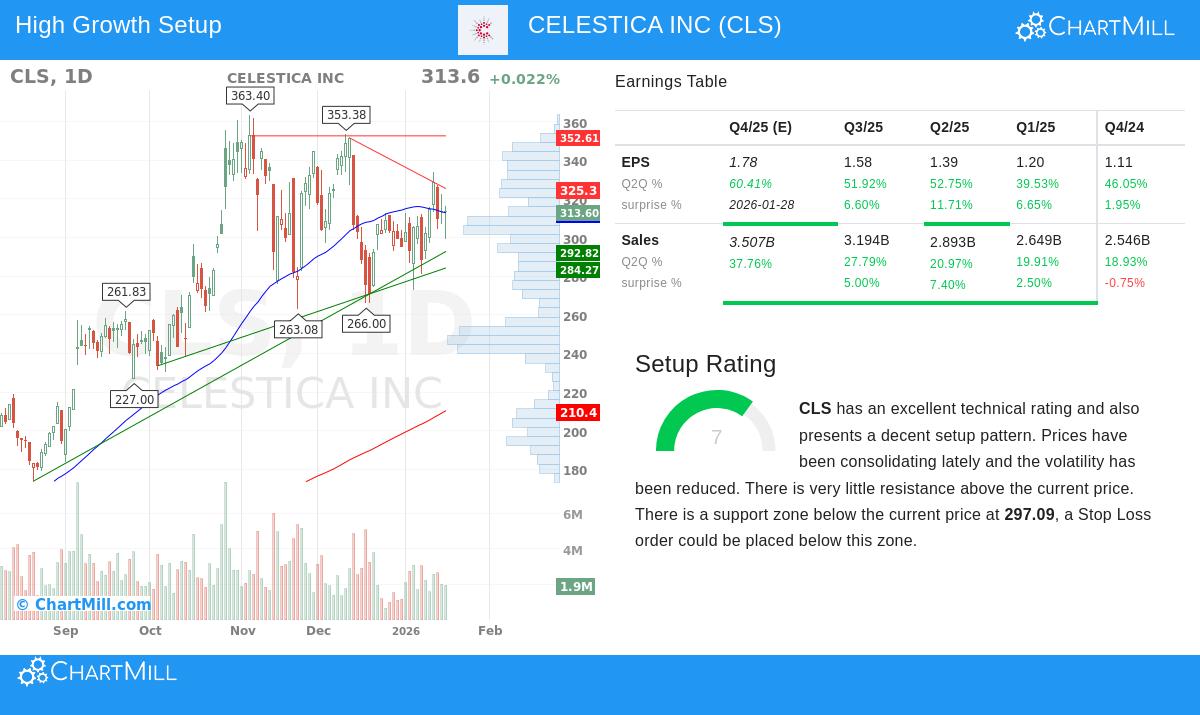
The last part is the present chart formation. CLS has a Setup Rating of 7, which measures the grade of its consolidation pattern. The technical report notes that "prices have been consolidating lately and the volatility has been reduced," a typical sign of a base developing before a possible next step up.
The setup review finds:
- A defined support area between $292.82 and $297.09, made by a meeting of moving averages and trendlines. This gives a reasonable zone for a stop-loss order, setting the trade's risk.
- Close resistance near $325.30. A clear move above this point could indicate a breakout from the recent consolidation.
- Lowered volatility during this consolidation period, which often comes before a notable directional move.
For investors, this setup is key. It gives a set entry point (a breakout above resistance), a logical exit point to control risk (below support), and hints the stock is "winding" after a strong earlier rise, possibly building force for its next move.
Finding Like Chances
The screening method that found Celestica, joining High Growth Momentum, good Technicals, and a grade Setup, can be used in a regular way to find other possible chances in the market. This multi-rating method effectively filters for companies where forceful earnings trends meet positive chart patterns.
For investors wanting to see present stocks that fit these exact standards, the ready-made screen is available to use: View High Growth Momentum Breakout Setups.
Disclaimer: This article is for information only and is not investment advice, a suggestion, or an offer or request to buy or sell any securities. The review is based on data and ratings from ChartMill, which can change. All investment choices carry risk, including the possible loss of principal. Investors should do their own separate research and think about their personal money situation, risk comfort, and investment goals before any investment choice. Past results do not guarantee future outcomes.