
GRUPO CIBEST SA-ADR (NYSE:CIB) has recently appeared as an interesting candidate for investors using a combined technical and fundamental growth strategy. The selection process used a screening method that brings together Mark Minervini’s Trend Template, a strict set of technical rules made to find stocks in solid uptrends, with a High Growth Momentum (HGM) rating system that focuses on accelerating earnings, revenue growth, and positive analyst revisions. This two-part method makes sure that found securities not only show good price momentum and chart health but also have the basic fundamental drivers that can push continued outperformance.
Technical Strength and Trend Template Alignment
A main part of the Minervini strategy is the Trend Template, which requires stocks to show alignment across several moving averages, good relative strength, and closeness to new highs. CIB fits these rules well, showing a stock in a clear Stage 2 uptrend.
Key technical confirmations include:
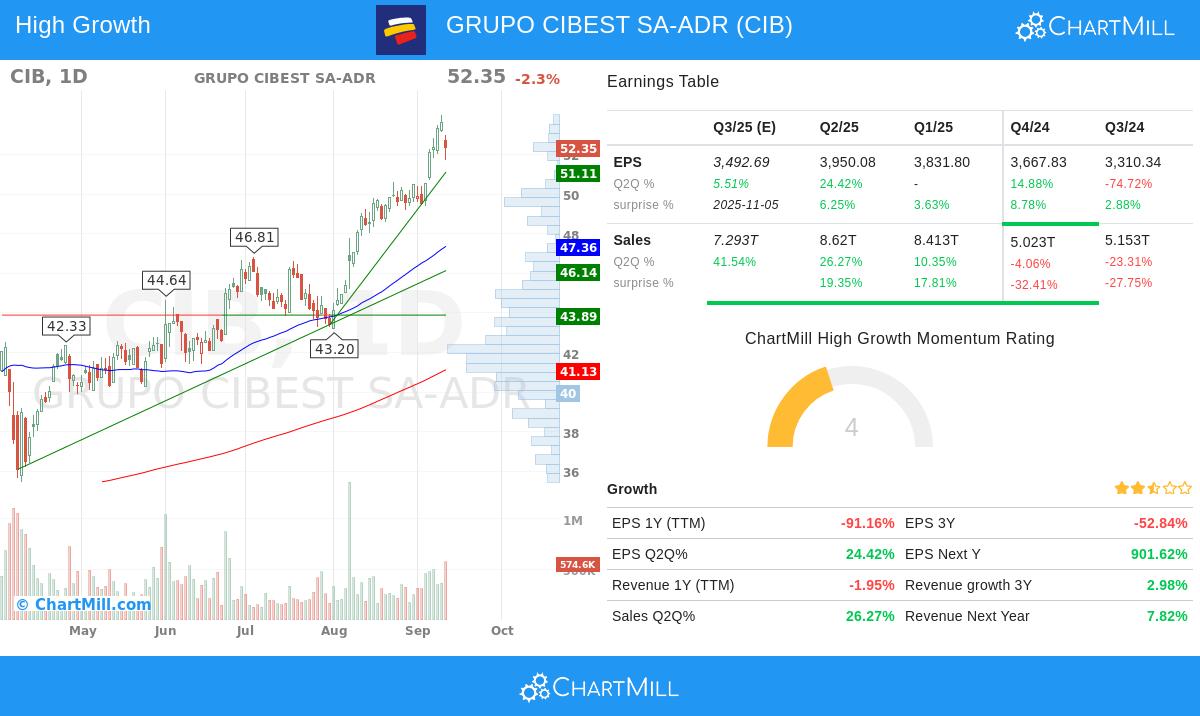
- The current price of $52.35 trades well above the 50-day SMA ($47.36), 150-day SMA ($43.62), and 200-day SMA ($41.13), confirming both short and long-term bullish alignment.
- All major moving averages are rising, with the 200-day SMA advancing from 41.03 to 41.13, indicating continued upward momentum.
- With a 52-week high of $53.99, the stock is trading within 3% of its peak, meeting the requirement that prices stay within 25% of new highs, a sign of good momentum.
- The stock’s relative strength ranking of 89.62 indicates it is doing better than nearly 90% of all stocks in the market, and it ranks in the top 3% within the Banks industry, highlighting sector leadership.
These factors are important within the Minervini framework because they help filter out unstable or weakening trends, focusing only on equities with confirmed strength and institutional support.
Fundamental Growth and Momentum Drivers
Beyond technicals, the screen focuses on high growth momentum, which looks at recent and projected performance in earnings, revenue, and profit margins. CIB displays several positive fundamental traits that fit with growth investing principles.
Notable fundamental points:
- Quarterly EPS growth shows a solid increase of 24.42% year-over-year, with the previous quarter also posting growth of 14.88%. This acceleration is a positive signal, though investors should note the full-year EPS decline, which may reflect one-time or non-recurring factors.
- Revenue growth in the most recent quarter surged by 26.27%, a large improvement that suggests growing business activity or market share.
- Analyst sentiment is optimistic, with next-year EPS estimates revised upward by 6.11% over the past three months, and revenue expectations lifted by 7.97%, indicating confidence in future performance.
- The company has beaten EPS estimates in all of the last four quarters, with an average surprise of 21.79%, showing a steady ability to exceed expectations.
These elements are key for growth-oriented strategies because they show a company’s ability to generate better financial results, which often draws institutional interest and supports further price appreciation.
Support Levels and Risk Considerations
From a risk management view, CIB’s chart shows several set support zones, including a major area between $46.14 and $47.83, which combines trendline and moving average support on daily and weekly timeframes. These levels can act as logical areas for stop-loss placement, fitting with Minervini’s focus on defined exit points to handle downside.
Technical Overview and Next Steps
The technical report for CIB gives a rating of 10/10, reflecting excellent trend health, while the setup rating of 5/10 suggests the stock may be extended in the short term and could gain from a consolidation period before providing a better entry. The overall assessment indicates good performance alignment with both the market and its sector, though volatility has risen recently.
For a detailed analysis, readers can review the full technical report here.
Investors interested in exploring similar opportunities can find additional candidates through the High Growth Momentum + Trend Template screen.
Disclaimer: This article is for informational and educational purposes only and does not constitute investment advice. Investors should conduct their own research and consider their risk tolerance before making any investment decisions.