
GRUPO CIBEST SA-ADR (NYSE:CIB) has become a notable option for investors using a dual-focus strategy that joins Mark Minervini’s strict trend-following system with a high-growth momentum screen. This process finds stocks showing both solid technical health and faster fundamental improvement, traits often seen in leading stocks ready for more gains. By selecting securities that meet Minervini’s Trend Template rules and display high growth momentum, the process intends to find stocks in strong uptrends backed by better business results.
Technical Health Through the Minervini View
A key part of Minervini’s strategy is finding stocks in clear, strong uptrends, what he calls "Stage 2" advances. CIB currently meets all main technical rules of the Trend Template, indicating a high-probability setup from a price action viewpoint.
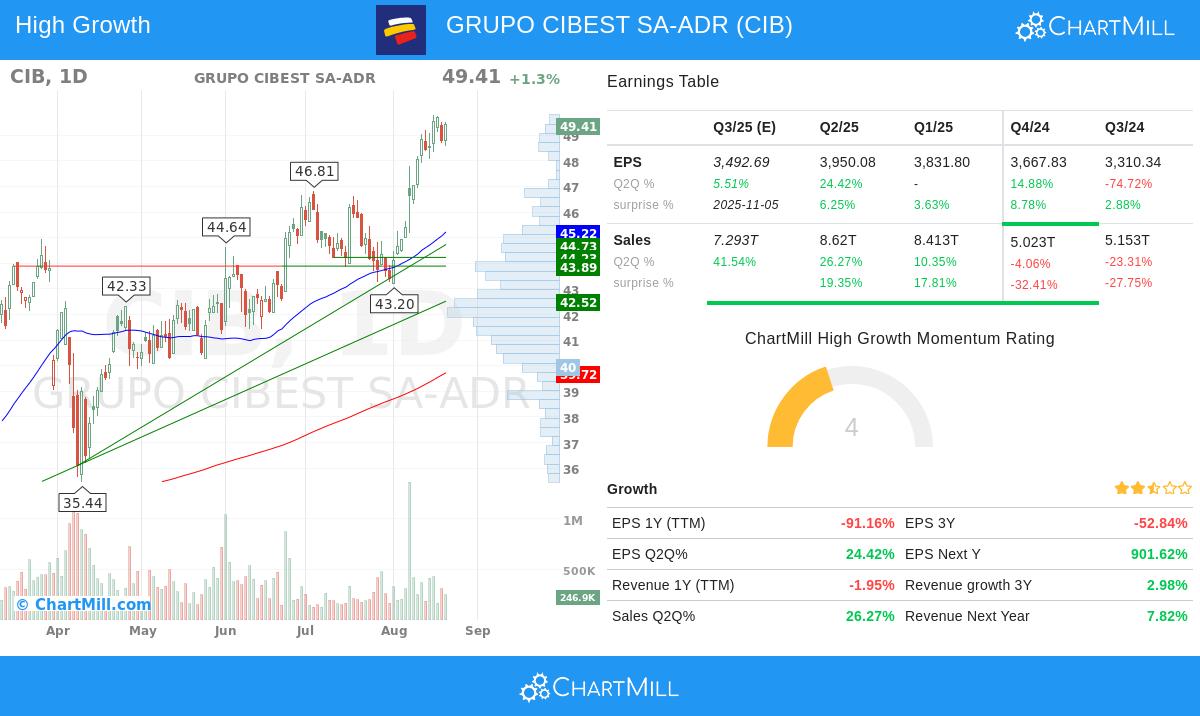
The stock is trading well above its main moving averages, with a current price of $49.41 compared to the 150-day SMA of $42.17 and the 200-day SMA of $39.72. More importantly, these moving averages are all moving up, confirming continued bullish momentum across multiple timeframes. The 50-day SMA at $45.22 is above both the 150-day and 200-day averages, forming the stacked moving average setup that Minervini highlights as vital for confirming trend health.
CIB shows major price gains from its cycle low, trading 61% above its 52-week low of $30.65 while staying within 1% of its 52-week high of $49.79. This mix of strong recovery and nearness to new highs shows both momentum and chance for more breakout movement. The stock's relative strength ranking of 89.7 puts it with the best performers market-wide, doing better than 90% of all stocks, a main trait of market leaders that Minervini focuses on.
Fundamental Momentum Catalysts
Beyond technicals, the high growth momentum screen finds companies with faster business fundamentals. CIB displays several positive fundamental traits that point to underlying business gains.
The company has shown notable quarterly earnings growth, with EPS rising 24.4% in the latest quarter compared to the same quarter last year. This marks a major speed-up from earlier quarters and hints at better profitability trends. Revenue growth has also been solid, with the last quarter showing 26.3% year-over-year growth.
Notably, CIB has exceeded EPS estimates in all of the past four quarters, with an average beat of 21.8%, showing steady outperformance versus analyst expectations. The profit margin has shown quarterly improvement, growing from 9.7% three quarters ago to 11.7% in the most recent quarter, showing better operational efficiency.
Analysts have reacted to this better performance by raising their revenue estimates, with next-year revenue expectations growing by 6.3% over the past three months. This positive revision activity often comes before more institutional interest and price gains.
Strategic Fit and Market Setting
The mix of solid technical placement and better fundamentals forms a notable investment case under the Minervini system. The trend template rules make sure the stock is in a confirmed uptrend with institutional backing, while the growth momentum filters find companies with fundamental speed that can maintain the price rise.
The current market setting, with both short-term and long-term S&P 500 trends positive, gives a supportive background for continuation of this momentum. CIB's sector leadership, doing better than 96% of banking sector stocks, further confirms its health within a positive industry context.
Technical Review Summary
According to ChartMill's technical review report, CIB gets a perfect technical rating of 10/10, showing outstanding technical health across all measured parameters. The stock displays positive trends across all timeframes, solid relative performance, and trades near 52-week highs. The report notes several support levels between $31.58 and $45.52, giving clear risk management levels, while resistance is near the current price around $49.70. View the full technical review report for detailed review and charts.
For investors looking for more options that meet this strict mix of technical health and growth momentum, the screening process that found CIB can provide more opportunities.
Disclaimer: This review is given for informational and educational reasons only and does not form investment advice, recommendation, or solicitation to buy or sell any securities. Investors should do their own research and talk to a qualified financial advisor before making investment decisions. Past performance is not a guide to future results.