
Discover THE CIGNA GROUP (NYSE:CI), an undervalued stock highlighted by our stock screener. NYSE:CI showcases solid financial health and profitability while maintaining an appealing valuation. We'll explore the details.
Valuation Assessment of NYSE:CI
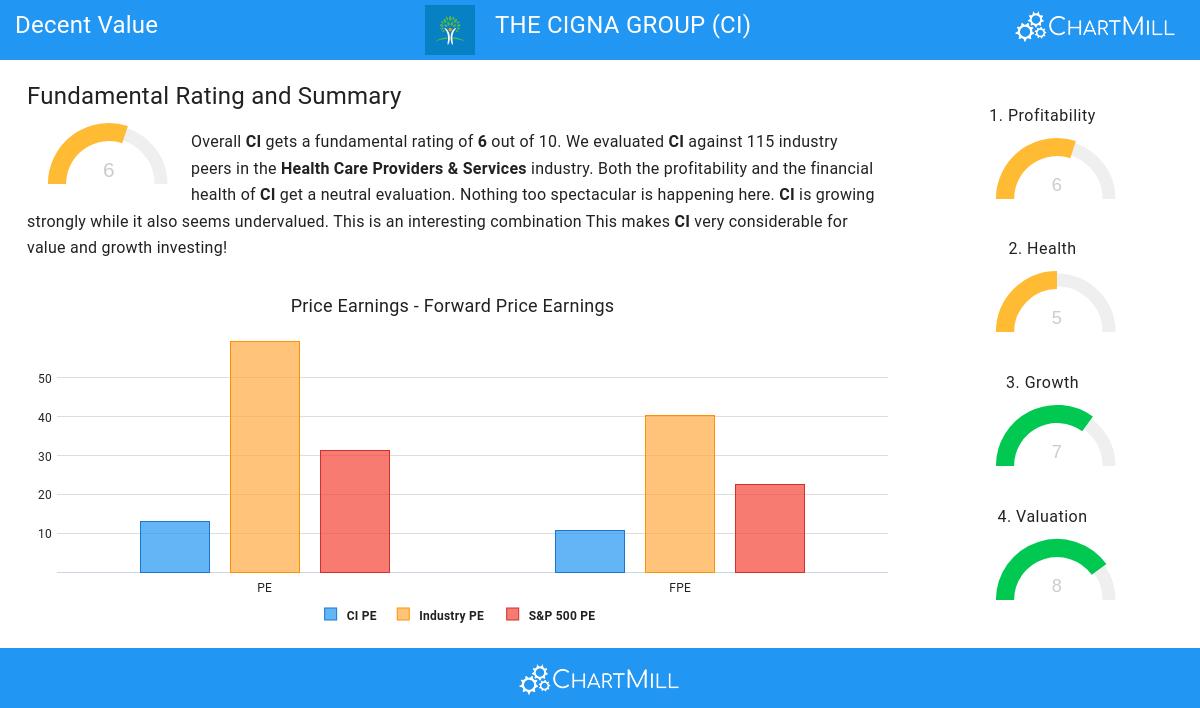
An integral part of ChartMill's stock analysis is the Valuation Rating, which spans from 0 to 10. This rating evaluates diverse valuation factors, including price to earnings and cash flows, while considering the stock's profitability and growth. NYSE:CI has received a 8 out of 10:
- Based on the Price/Earnings ratio, CI is valued cheaper than 90.35% of the companies in the same industry.
- CI's Price/Earnings ratio indicates a rather cheap valuation when compared to the S&P500 average which is at 31.19.
- Based on the Price/Forward Earnings ratio of 10.58, the valuation of CI can be described as reasonable.
- CI's Price/Forward Earnings ratio is rather cheap when compared to the industry. CI is cheaper than 92.98% of the companies in the same industry.
- When comparing the Price/Forward Earnings ratio of CI to the average of the S&P500 Index (22.50), we can say CI is valued rather cheaply.
- CI's Enterprise Value to EBITDA ratio is rather cheap when compared to the industry. CI is cheaper than 81.58% of the companies in the same industry.
- Based on the Price/Free Cash Flow ratio, CI is valued cheaper than 86.84% of the companies in the same industry.
- CI's low PEG Ratio(NY), which compensates the Price/Earnings for growth, indicates a rather cheap valuation of the company.
- CI has a very decent profitability rating, which may justify a higher PE ratio.
- CI's earnings are expected to grow with 13.72% in the coming years. This may justify a more expensive valuation.
Evaluating Profitability: NYSE:CI
Discover ChartMill's exclusive Profitability Rating, a proprietary metric that assesses stocks on a scale of 0 to 10. It takes into consideration various profitability ratios and margins, both in absolute terms and relative to industry peers. Notably, NYSE:CI has achieved a 6:
- CI has a Return On Assets of 2.39%. This is in the better half of the industry: CI outperforms 66.67% of its industry peers.
- CI has a better Return On Equity (8.97%) than 74.56% of its industry peers.
- The Return On Invested Capital of CI (8.45%) is better than 83.33% of its industry peers.
- The last Return On Invested Capital (8.45%) for CI is above the 3 year average (7.18%), which is a sign of increasing profitability.
- With a decent Profit Margin value of 1.70%, CI is doing good in the industry, outperforming 68.42% of the companies in the same industry.
- CI's Operating Margin of 4.39% is fine compared to the rest of the industry. CI outperforms 62.28% of its industry peers.
Understanding NYSE:CI's Health
ChartMill employs its own Health Rating for stock assessment. This rating, ranging from 0 to 10, is calculated by examining various liquidity and solvency ratios. In the case of NYSE:CI, the assigned 5 reflects its health status:
- Looking at the Altman-Z score, with a value of 2.42, CI is in the better half of the industry, outperforming 60.53% of the companies in the same industry.
- Looking at the Debt to FCF ratio, with a value of 4.01, CI belongs to the top of the industry, outperforming 81.58% of the companies in the same industry.
Analyzing Growth Metrics
ChartMill employs its own Growth Rating system for all stocks. This score, ranging from 0 to 10, is derived by evaluating different growth factors, such as EPS and revenue growth, taking into account both past performance and future projections. NYSE:CI has earned a 7 for growth:
- CI shows a strong growth in Earnings Per Share. In the last year, the EPS has been growing by 18.68%, which is quite good.
- CI shows quite a strong growth in Earnings Per Share. Measured over the last years, the EPS has been growing by 11.91% yearly.
- Looking at the last year, CI shows a quite strong growth in Revenue. The Revenue has grown by 17.09% in the last year.
- Measured over the past years, CI shows a very strong growth in Revenue. The Revenue has been growing by 32.15% on average per year.
- Based on estimates for the next years, CI will show a quite strong growth in Earnings Per Share. The EPS will grow by 12.60% on average per year.
- Based on estimates for the next years, CI will show a quite strong growth in Revenue. The Revenue will grow by 9.87% on average per year.
Every day, new Decent Value stocks can be found on ChartMill in our Decent Value screener.
Our latest full fundamental report of CI contains the most current fundamental analsysis.
Disclaimer
Important Note: The content of this article is not intended as trading advice. It is essential to perform your own analysis and exercise caution when making trading decisions. The article presents observations created by automated analysis but does not guarantee any trading or investment outcomes. Always trade responsibly and make independent judgments.