
For technical investors, finding stocks that are both fundamentally sound and ready for a near-term price change is a primary goal. One way to do this is by searching for stocks that have both a high technical health score and a high-quality setup pattern. This method finds market leaders that are not only in a good trend but are also moving in a narrow band, indicating a possible breakout is near. The aim is to locate chances where a stock's existing force matches a good entry point, seeking to join the next phase of a current upward trend.
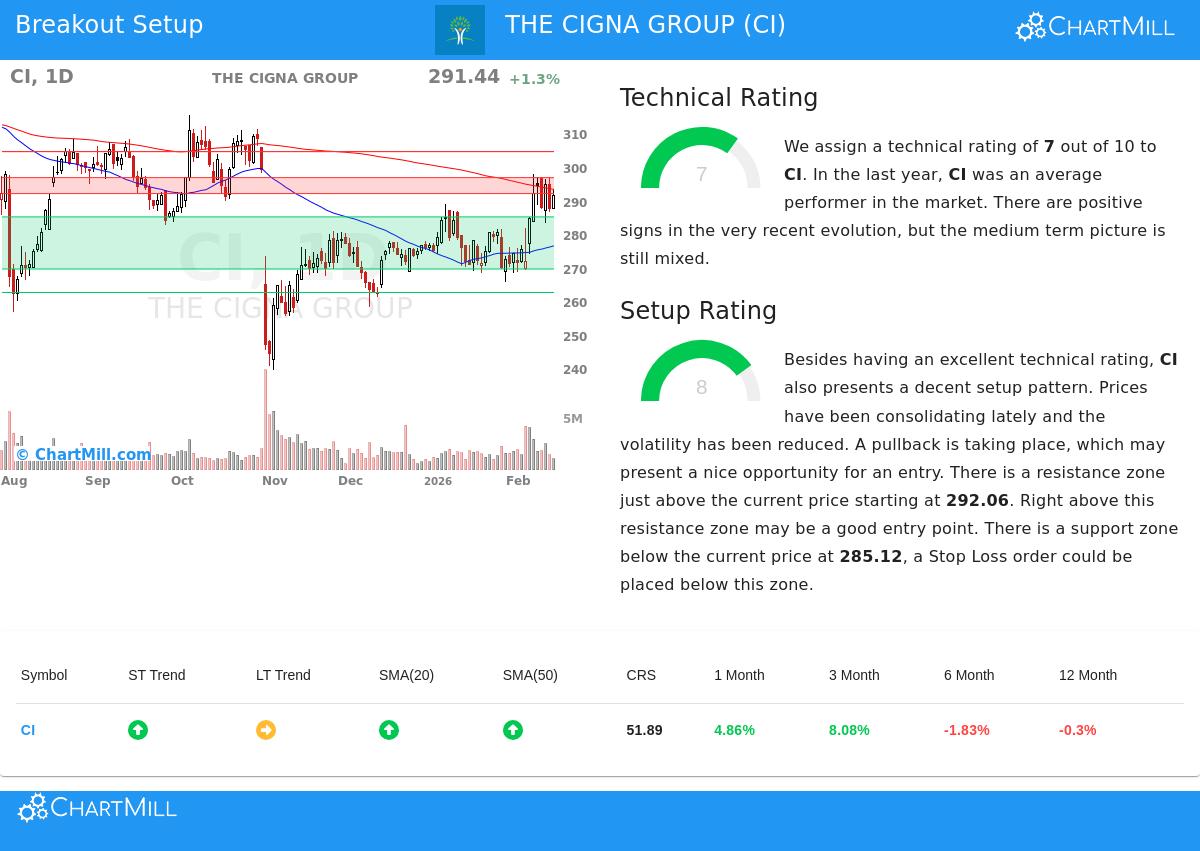
THE CIGNA GROUP (NYSE:CI), a worldwide health services company, recently appeared from this kind of technical breakout search. The search specifically finds stocks with a ChartMill Technical Rating of 7 or more and a Setup Quality Rating of 7 or more. Cigna's present scores of 7 and 8, in that order, put it clearly in this group of possible breakout choices.
Technical Condition and Market Standing
The ChartMill Technical Rating of 7 shows that Cigna is in a technically acceptable condition, favoring an upward trend. This number combines several elements to measure the stock's force and comparative strength. A closer examination of the full technical report shows the varied but bettering situation that forms this rating.
- Trend Behavior: The long-term trend is seen as neutral, but importantly, the short-term trend is good. This indicates that while the stock may have had longer-term issues, recent price action is winning investor approval, a needed state for a lasting breakout.
- Moving Average Position: The stock is priced above its important short- and medium-term moving averages (20-day, 50-day, and 100-day SMAs), and these averages are themselves in rising arrangements. This position is a typical signal of growing positive force.
- Comparative Results: Over the last year, Cigna has done better than 51% of all stocks and 58% of similar companies in the Health Care Providers & Services field. While this makes it an average performer in general, the good change in short-term trend and moving averages suggests this comparative strength could be getting better.
A firm technical rating is basic for this plan because it makes sure an investor is moving with the current force instead of opposing it. It answers the first vital question: Is this a stock to think about?
Setup Condition and Narrowing Pattern
While a good technical rating finds a strong stock, a high Setup Quality Rating of 8 deals with the just as important question of when. This score checks if the chart shows a clear, steady narrowing pattern from which a breakout can happen.
Cigna's setup review points out several positive states:
- Set Trading Band: Over the last month, the stock has moved within a band between about $265.75 and $297.80. It is now trading close to the top of this band, showing it is testing a main resistance point.
- Clear Support and Resistance: The technical report notes a major support area between $269.60 and $285.12, made by a mix of trendlines and moving averages. Just above the present price, a resistance area exists between $292.06 and $296.82.
- Lowered Instability and Decline: The review states that "prices have been narrowing recently and the instability has been lowered. A decline is happening, which may offer a good chance for an entry."
This narrowing is exactly what the breakout plan looks for. A tight band after a rise lets the stock absorb its increases, often preparing for the next upward move if it can clearly break past the overhead resistance.
A Possible Breakout Situation
From this review, a specific setup comes out. The noted resistance area near $296.82 is the close barrier. A clear move past this point could mark the beginning of a new positive stage, giving a possible entry point. The nearby support area gives a reasonable place to set a protective stop-loss order, aiding in risk control if the breakout does not succeed.
For investors curious about this method, new possible breakout setups are found each day. You can review the present list of qualifying stocks by going to the Technical Breakout Setups screen.
Disclaimer: This article is for information only and is not investment advice, a suggestion, or an offer or request to buy or sell any securities. The review is based on technical signs and past data, which are not promises of future results. All investing has risk, including the chance of losing the original amount. You should do your own study and talk with a qualified financial advisor before making any investment choices.