
For investors who use charts and price action to guide their choices, a methodical way to spot possible opportunities is important. One approach looks for stocks that show both good technical condition and a clear, usable price pattern. This method finds securities that are in a verified uptrend and also trading in a narrow band, indicating a possible breakout move may be near. By joining a high technical score with a high setup quality score, traders try to find times when a stock's momentum could be ready to increase from a solid position.
CBRE Group Inc - A (NYSE:CBRE) has appeared from this kind of screening process, showing a profile that technical investors may find interesting. As a top global firm in commercial real estate services and investment, the company's stock is now showing traits that match this breakout approach.
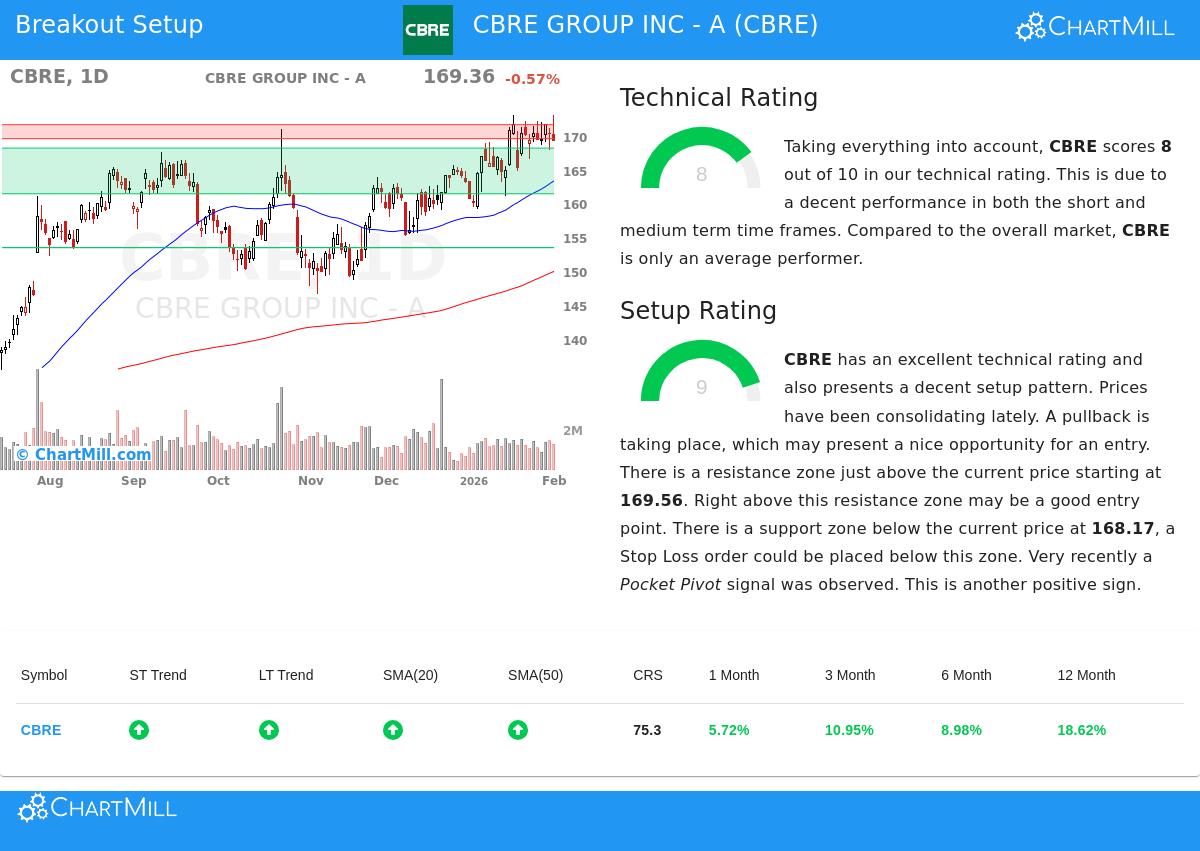
Looking at the Technical Base
The first part of this method is a stock's general technical condition, which tries to answer the question of which stock to review. A high technical score means a stock is in a steady uptrend, doing better than similar companies, and showing good momentum across different periods. CBRE Group gets a solid technical score of 8 out of 10, pointing to a technically good base.
A review of the detailed technical report shows several positive details:
- Trend Direction: Both the near-term and longer-term trends for CBRE are scored as good. This agreement across time frames is a positive sign, indicating momentum is part of a bigger, confirmed move.
- Sector Performance: In the Real Estate Management & Development sector, CBRE does better than 80% of its 62 competitors. This comparative performance is a key part of the technical score, as it indicates the stock is a top performer in its field.
- Price Level: The stock is trading close to its 52-week high, a mark of existing strength. This is especially significant with the present neutral trends seen in the wider S&P 500 index, emphasizing CBRE's separate performance.
- Moving Averages: The stock's price is above all important simple moving averages (20, 50, 100, and 200-day), and each average is rising. This arrangement of rising price levels is a typical sign of a good uptrend.
This overall technical view supports the high score and meets the method's first need: finding a stock with a good and dependable trend, making it a fit choice for a positive setup.
Reviewing the Setup Quality
The second important question for a trader is when to take a position. A high technical score by itself is not sufficient; buying after a fast, large increase holds danger. The setup quality score deals with this by finding times of narrow trading, which frequently come before the next upward move. CBRE has a very good setup score of 9, meaning a high-grade pattern is present.
The technical report explains why this setup exists:
- Recent Narrow Trading: Over the last month, CBRE has traded between about $159 and $173. The report states that prices have been in a narrow range lately, which can offer a good entry point as activity lessens before a possible increase.
- Defined Price Levels: The analysis notes a specific support area below the present price (from $161.43 to $168.17) and a resistance area just above (from $169.56 to $171.62). These clear zones give sensible points for setting stop-loss orders and noting breakout signals.
- Volume Indicator: A "Pocket Pivot" signal was seen very recently. This is a volume indicator that points to buying interest, where the stock rises on higher volume than the falling volume of earlier days, often indicating institutional activity.
This high setup score is key to the method because it suggests the stock is resting within its confirmed uptrend. It gives a more defined, lower-risk plan for entering, compared to buying a stock that is already in a fast rise.
A Possible Trade Plan
From this joined review of strength and setup, the technical report presents a sample trade plan. It proposes a possible entry point just above the noted resistance area at $171.63, with a stop-loss order set below the nearby support around $164.84. This would set the trade's risk at about 4% of the entry price. It is important to note that this is an automatically created example from technical levels only; real trading choices must include personal risk limits, position size, and knowledge of events like earnings reports.
Locating Other Technical Ideas
The screening process that found CBRE Group is used each day to the market, revealing new possible breakout setups as they develop. Investors wanting to see the present list of stocks fitting similar needs of good technical scores and high-grade setups can view the results through the Technical Breakout Setups screen.
Disclaimer: This article is for information only and is not investment advice, a suggestion, or an offer or request to buy or sell any securities. The review uses technical data and automated scoring models. All investing and trading has risk, including the possible loss of principal. Readers should do their own research and talk with a qualified financial advisor before any investment choices. Past results do not guarantee future outcomes.