
Investors aiming to benefit from large price gains frequently use a method that combines solid core business progress with good market timing. One way is to look for stocks showing solid basic growth, marked by quickening profits and sales, while also having positive chart patterns that indicate a possible upward move. This process tries to find firms that are not only growing their operations faster than normal but are also near to getting more investor notice, as seen in their stock charts. The aim is to locate chances where basic soundness and chart alignment come together, possibly marking the start of a continued rise.
CBRE Group Inc. (NYSE:CBRE), the worldwide commercial real estate services and investment leader, recently appeared from a search made to find this kind of overlap. The search selected for stocks with good growth records, acceptable financial condition and earnings, and a favorable chart rating. A detailed look at CBRE's basic and chart reports shows why it matches this particular investment idea.
Basic Growth Driver
Central to this idea is finding companies doing better than others. CBRE's basic analysis report shows it is doing exactly that in the Real Estate Management & Development group. The firm gets a Growth Rating of 7 out of 10, the top of its five basic category scores. This score is backed by notable recent results and firm future estimates.
- Recent Results: Income increased by 14.61% over the last year, and the five-year average yearly growth is at an acceptable 8.40%. More notably, Earnings Per Share (EPS) rose by 43.41% in the last year.
- Future Estimate: Experts forecast this progress to keep going, with estimated yearly EPS growth of 17.98% and income growth of 9.04% in the next years. The report states that EPS growth is quickening relative to its past speed.
- Context for Price: While the firm's Price-to-Earnings (P/E) ratio seems high alone, its price becomes more sensible when growth is considered. The PEG ratio, which changes the P/E for growth, shows a fair price. Also, compared to its group peers, which trade at much higher average P/E and forward P/E multiples, CBRE's price is relatively appealing.
This basic picture is key because continued growth in profits and income is the main force behind long-term stock price gains. A firm that is regularly increasing its income and profits at a strong pace gives a firm base for the stock to rise.
Chart Position for a Possible Move Up
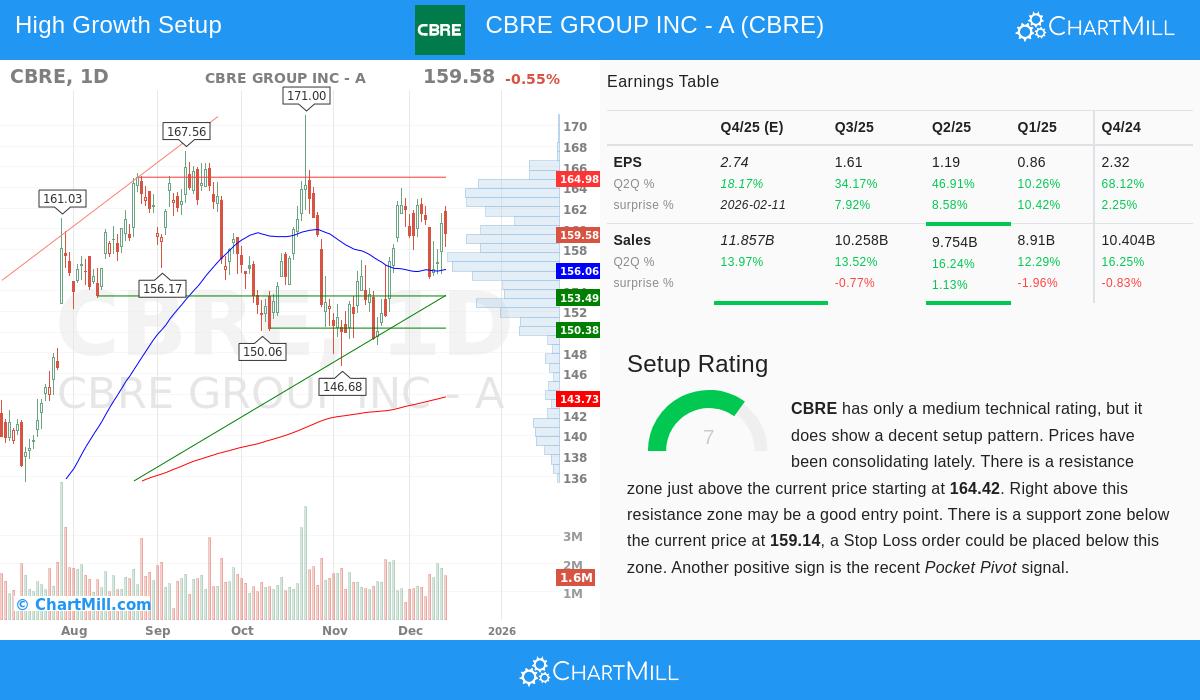
Finding a basically sound firm is only one piece; the other is judging the market's present view of the stock through chart study. CBRE's chart report shows a stock forming a base after a good rise, now checking a main price ceiling. The report gives a Setup Rating of 7, pointing out an "acceptable formation."
- Direction and Place: The long-term direction for CBRE is up, and the stock is now trading in the higher part of its 52-week span. It has been forming a base in a span between about $149 and $164 over the last month, building a foundation close to its highs.
- Main Prices: The chart study finds a clear price ceiling between $164.42 and $165.91. A continued move above this area could mark a move up and the start of a new rise. A price floor is seen near the $156 area, matching key average lines.
- Recent Sign: Adding to the positive view, the report notes a recent "Pocket Pivot" sign, a formation that shows buying interest, which often comes before a move up.
The existence of a clear price ceiling after a time of forming a base is central to the move-up method. It gives a specific point where buyer strength overcomes seller pressure, possibly leading to a fast price gain as new interest enters the stock.
Earnings and Financial Condition Review
The search method includes checks for earnings and financial condition to filter out uncertain, untested growth cases. CBRE scores a neutral but acceptable 6 for Earnings and 5 for Financial Condition. Main points include:
- Earnings Strengths: The firm shows good returns on capital, with its Return on Equity (14.39%) and Return on Invested Capital (6.76%) beating a large part of group rivals.
- Condition Points: While the firm has a moderate amount of debt (Debt/Equity of 0.84), which matches its group, its cash ratios (Current and Quick Ratio) are a bit lower than peers. However, its Altman-Z score shows no short-term failure risk. The basic condition check makes sure the firm's growth is not powered by too much financial risk.
An Overlapping Chance
CBRE Group presents a case where the basic and chart studies overlap to create a list candidate for growth-focused investors. The firm is showing quickening profit growth within a group where it has a top place, and it is doing so at a price that is sensible compared to its peers. On the chart, the stock is tightening near a set price ceiling after a time of forming a base, with recent volume formations suggesting institutional buying.
This overlap is what the combined search method tries to find: a basically good growth firm that is also placed on the chart for a possible change in interest. Investors can study the full analysis that shaped this view by looking at CBRE's complete Fundamental Analysis Report and Technical Analysis Report.
For investors wanting to find other stocks that meet this specific mix of good growth and positive chart formations, more study can be done using the set search: Strong Growth Stocks with Good Technical Setup Ratings.
Disclaimer: This article is for information only and does not make financial guidance, a suggestion, or a bid to buy or sell any securities. The study is based on data and reports given by other parties. Investing has risk, including the possible loss of original funds. Always do your own study and think about talking with a qualified financial advisor before making any investment choices.