
CBRE Group Inc, A (NYSE:CBRE) has become an attractive option for investors looking for growth stocks with positive technical setups. The selection method blends fundamental and technical analysis, focusing on companies with strong earnings growth, good profitability, and stable finances, along with bullish price patterns. This combined approach highlights stocks with solid business performance and upward price movement potential.
Why CBRE Is a Strong Growth Stock
CBRE’s fundamentals match the requirements for growth investing, as described in our introduction to growth stocks. The company works in the commercial real estate industry, offering advisory, workplace solutions, and investment management services, a market with considerable growth opportunities as global real estate trends shift.
Key fundamental strengths include:
- Impressive Growth Metrics: CBRE’s revenue increased 14.96% year-over-year, while earnings per share (EPS) rose 50.95% in the past year. Analysts expect annual EPS growth of 16.71%, suggesting ongoing progress.
- Competitive Valuation: With a P/E ratio of 27.90, CBRE is more affordable than 78% of its industry peers, which average a P/E of 35.54. Its forward P/E of 21.57 indicates potential for further growth.
- High Profitability: The company has a Return on Equity (ROE) of 13.21%, better than 96.88% of competitors in the Real Estate Management & Development sector.
- Financial Stability: While leverage is moderate (Debt/Equity of 0.88), CBRE maintains good liquidity with a current ratio of 1.13 and a stable Altman-Z score of 3.52, indicating low risk of financial trouble.
For more details on CBRE’s fundamentals, see the full fundamental analysis report.
Technical Upside Potential
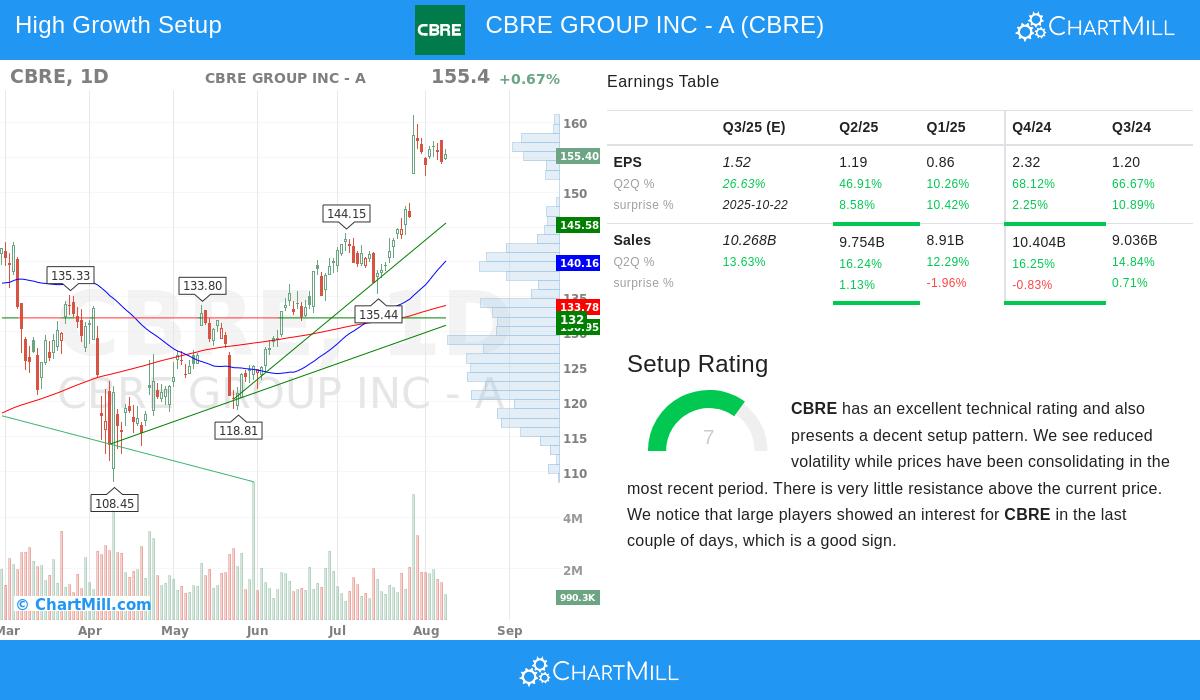
From a technical standpoint, CBRE shows a positive setup, supporting its growth story:
- Upward Trend: Both short-term and long-term trends are favorable, with the stock trading above key moving averages (20-day, 50-day, 100-day, and 200-day SMAs).
- Bull Flag Pattern: The recent pullback after a strong rise suggests a pause before a possible resumption of the upward trend.
- Support Levels: Multiple support areas exist between $127.67 and $145.58, offering protection against declines.
- Breakout Chance: A clear move above $158.06 could lead to further gains, with little resistance above.
The stock’s relative strength is better than 87% of the market, and its sector performance ranks in the top 16%. For a full technical review, check the technical analysis report.
Why This Mix Is Important
Growth stocks with strong technical setups often offer good opportunities because:
- Fundamentals Support Growth: Earnings growth and profitability back the stock’s upward trend.
- Technical Strength Adds Confidence: Breakouts from patterns like bull flags suggest continued interest and trend persistence.
- Risk Control: Clear support levels help set stop-loss points, while breakout levels provide entry signals.
Finding More Opportunities
CBRE is one example of a stock fitting these criteria. Investors looking for similar options can use our Strong Growth Stocks with Good Technical Setup Ratings screener to find other promising candidates.
,
Disclaimer: This article is for informational purposes only and does not constitute investment advice. Always conduct your own research or consult a financial advisor before making investment decisions.